Redbox 2003 Annual Report Download - page 23
Download and view the complete annual report
Please find page 23 of the 2003 Redbox annual report below. You can navigate through the pages in the report by either clicking on the pages listed below, or by using the keyword search tool below to find specific information within the annual report.-
 1
1 -
2
-
3
-
4
-
5
-
6
-
7
-
8
-
9
-
10
-
11
-
12
-
 13
13 -
 14
14 -
 15
15 -
 16
16 -
 17
17 -
 18
18 -
 19
19 -
 20
20 -
 21
21 -
 22
22 -
 23
23 -
 24
24 -
 25
25 -
 26
26 -
 27
27 -
 28
28 -
 29
29 -
 30
30 -
 31
31 -
 32
32 -
 33
33 -
34
-
35
-
36
-
37
-
38
-
39
-
40
-
41
-
42
-
43
-
44
-
45
-
46
-
47
-
48
-
49
-
50
-
51
-
52
-
53
-
54
-
55
-
56
-
57
 |
 |

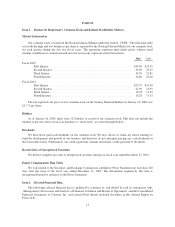
Discontinued Operations: In 2001, we discontinued the operations of our subsidiary, Meals.com. This
business segment was accounted for as discontinued operations in accordance with APB Opinion No. 30,
Reporting the Results of Operations—Reporting the Effects of Disposal of a Segment of a Business, and
Extraordinary, Unusual and Infrequently Occurring Events and Transactions (“APB No. 30”).
In accordance with APB No. 30, the disposal of our Meals.com business resulted in a loss of $3.4 million,
which was recorded in the fiscal year ended December 31, 2001. Included in this amount is a $2.4 million loss
primarily related to the write-down of assets, as well as operating losses of $1.0 million resulting from the wind-
down of the Meals.com business.
Results of Operations
Our consolidated financial information presents the net effect of discontinued operations separate from the
results of our continuing operations. Historical financial information has been reclassified to present consistently
the discontinued operations. The discussion and analysis that follows generally focuses on continuing operations.
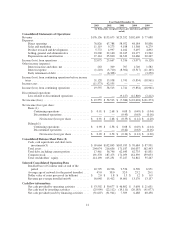
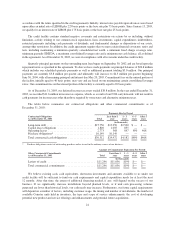
The following table shows revenue and expenses as a percent of revenue for the last three years:
Year Ended December 31,
2003 2002 2001
Revenue .............................................. 100.0% 100.0% 100.0%
Expenses:
Direct operating .................................... 43.6 43.5 44.9
Sales and marketing ................................. 6.3 6.0 7.1
Product research and development ...................... 3.3 3.2 3.2
Selling, general and administrative ..................... 13.2 14.2 17.2
Depreciation and amortization ......................... 15.4 16.6 20.4
Income from operations .................................. 18.2% 16.5% 7.2%
Years Ended December 31, 2003 and 2002
Revenue
Revenue increased to $176.1 million in 2003 from $155.7 million in 2002. Revenue grew principally as a
result of an increase in the number of transactions, the increase in the average number of Coinstar units in service
during 2003 and the volume of coins processed by the units in service during this period. The total dollar value of
coins processed through our network increased to approximately $2.0 billion during 2003 from approximately
$1.8 billion for the comparable prior year. The average installed base of Coinstar units increased to 10,976 in
2003 from 10,147 units in 2002. The average number of machines in 2003 takes into consideration
approximately 900 Coinstar units de-installed from Safeway stores during the third and fourth quarters of 2003.
As a result of the discontinuance of our Safeway relationship, we expect that our revenues may grow more
slowly in future periods.
Direct Operating Expenses
Direct operating expenses increased to $76.8 million in 2003 from $67.8 million in 2002. Direct operating
expenses increased primarily due to 1) an increase in the service fees paid to our retail partners resulting from a
13.1% increase in coin processing revenue, 2) an increase in coin pick-up and processing costs resulting from
19