Redbox 2003 Annual Report Download - page 24
Download and view the complete annual report
Please find page 24 of the 2003 Redbox annual report below. You can navigate through the pages in the report by either clicking on the pages listed below, or by using the keyword search tool below to find specific information within the annual report.-
 1
1 -
2
-
3
-
4
-
5
-
6
-
7
-
8
-
9
-
10
-
11
-
12
-
13
-
 14
14 -
 15
15 -
 16
16 -
 17
17 -
 18
18 -
 19
19 -
 20
20 -
 21
21 -
 22
22 -
 23
23 -
 24
24 -
 25
25 -
 26
26 -
 27
27 -
 28
28 -
 29
29 -
 30
30 -
 31
31 -
 32
32 -
 33
33 -
 34
34 -
35
-
36
-
37
-
38
-
39
-
40
-
41
-
42
-
43
-
44
-
45
-
46
-
47
-
48
-
49
-
50
-
51
-
52
-
53
-
54
-
55
-
56
-
57
 |
 |
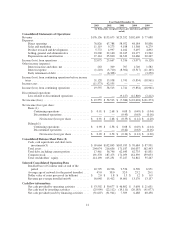
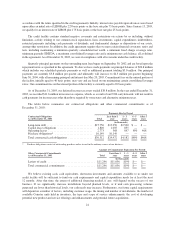
increased coin volumes processed during the year and 3) increases in field service expenses related to our
expansion into 28 new domestic and international regional markets during the year ended December 31, 2003.
Direct operating expenses as a percentage of revenue increased slightly to 43.6% in 2003 from 43.5% in 2002.
The increase in direct operating expenses as a percentage of revenue resulted from an increase in expenses
associated with the service fees we pay to our retail partners and the cost of refurbishing and maintaining our
Coinstar units. These increases were offset by a decrease in per unit field service, coin processing and
telecommunications expenses. During 2004 we anticipate incurring refurbishment costs of about $3.2 million to
bring de-installed Coinstar units to like-new condition. As a result of increasing competitive and pricing
pressures, we may see our direct operating expenses increase in future periods.
Sales and Marketing
Sales and marketing expenses increased to $11.1 million in 2003 from $9.3 million in 2002. Sales and
marketing expenses increased due to a shift from radio advertising to national cable television advertising in the
United States as well as increased radio advertising in the United Kingdom. During 2003, our usage of national
cable television advertising extended our advertising coverage to less densely populated areas of the country. As
we expand our network of Coinstar units, we will continue to analyze and use cost effective ways to reach our
growing potential customer base. Sales and marketing as a percentage of revenue increased to 6.3% in 2003 from
6.0% in 2002.
Product Research and Development
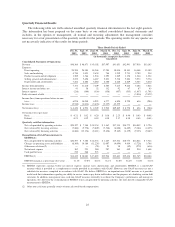
Product research and development expenses increased to $5.8 million in 2003 from $5.0 million in 2002.
Product research and development expenses grew primarily as the result of an increase in staffing levels to
support research and development to design and integrate complementary new product ideas and continue our
ongoing efforts to enhance our existing coin processing network. Product research and development expenses as
a percentage of revenue increased to 3.3% in 2003 from 3.2% in 2002.
Selling, General and Administrative
Selling, general and administrative expenses increased to $23.2 million in 2003 from $22.1 million in 2002.
Selling, general and administrative expenses increased in areas such as professional services (including legal and
accounting services), employee benefits, advertising production costs and corporate insurance policies. Selling,
general and administrative expenses as a percentage of revenue decreased to 13.2% in 2003 from 14.2% in 2002.
Depreciation and Amortization
Depreciation and amortization expense increased to $27.1 million in 2003 from $25.8 million in 2002.
Depreciation expense increased mainly due to losses recorded on the disposal of capital assets associated with
upgrading the computers in our Coinstar units. Depreciation and amortization as a percentage of revenue
decreased to 15.4% in 2003 from 16.6% in 2002. A greater number of Coinstar units became fully depreciated
between December 31, 2002 and December 31, 2003 than were newly installed in the same period.
Other Income and Expense
Interest income and other, net, decreased to $263,000 in 2003 from $309,000 in 2002. This decrease,
primarily in interest income, was attributed to both lower amounts of funds invested and lower interest rates
earned on investments in the year ended December 31, 2003 than in the prior year.
Interest expense decreased to $1.2 million in 2003 from $3.7 million in 2002. The decrease is due to a
combination of a decreased amount of outstanding debt and reduced interest rates in the year ended
December 31, 2003 compared to the prior year. As of December 31, 2003, we had $15.8 million of long-term
debt outstanding under our credit facility.
20