Qantas 2015 Annual Report Download - page 81
Download and view the complete annual report
Please find page 81 of the 2015 Qantas annual report below. You can navigate through the pages in the report by either clicking on the pages listed below, or by using the keyword search tool below to find specific information within the annual report.-
 1
1 -
2
-
3
-
4
-
5
-
6
-
7
-
8
-
9
-
10
-
11
-
12
-
13
-
14
-
15
-
16
-
17
-
18
-
19
-
20
-
21
-
22
-
23
-
24
-
25
-
26
-
27
-
28
-
29
-
30
-
31
-
32
-
33
-
34
-
35
-
36
-
37
-
38
-
39
-
40
-
41
-
42
-
43
-
44
-
45
-
46
-
47
-
48
-
49
-
50
-
51
-
52
-
53
-
54
-
55
-
56
-
57
-
58
-
59
-
60
-
61
-
62
-
63
-
64
-
65
-
66
-
67
-
68
-
69
-
70
-
 71
71 -
 72
72 -
 73
73 -
 74
74 -
 75
75 -
 76
76 -
 77
77 -
 78
78 -
 79
79 -
 80
80 -
 81
81 -
 82
82 -
 83
83 -
 84
84 -
 85
85 -
 86
86 -
 87
87 -
 88
88 -
 89
89 -
 90
90 -
 91
91 -
92
-
93
-
94
-
95
-
96
-
97
-
98
-
99
-
100
-
101
-
102
-
103
-
104
-
105
-
106
 |
 |

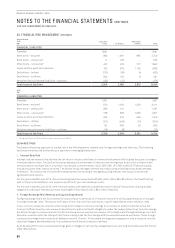
NOTES TO THE FINANCIAL STATEMENTS CONTINUED
FOR THE YEAR ENDED 30 JUNE 2015
80
QANTAS ANNUAL REPORT 2015
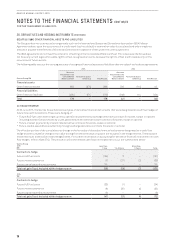
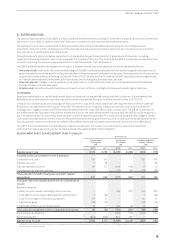
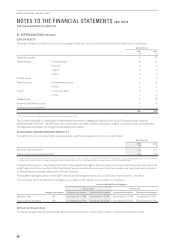
31. SUPERANNUATION CONTINUED
LN ASSETS
The major categories of plan assets as a percentage of total plan assets of the Group’s defined benefit plans are as follows:
Qantas Group
2015
%
2014
%
Australian equity114 18
Global equity1 –United States 911
–Europe 8 9
–Japan 2 2
–Other 4 7
Private equity 5 5
Fixed interest1 –Government bonds 11 12
–Other 9 7
Credit1 –Corporate debt 9 7
–Other 2 2
Hedge funds 11 10
Property and infrastructure 9 9
Cash and cash equivalents17 1
100 100
1 Majority of these plan assets have a quoted market price in an active market.
The Trustee of the QSP is responsible for setting the investment strategy and objectives for the QSP’s assets supporting the
defined benefit liabilities. The QSP does not currently use any asset-liability matching strategies. It utilises traditional investment
management techniques to manage the defined benefit assets.
(D) ACTUARIAL ASSUMPTIONS AND SENSITIVITY
The significant actuarial assumptions (expressed as weighted averages per annum) were as follows:
Qantas Group
2015
%
2014
%
Discount rate (Australia) 4.4 4.4
Future salary increases (Australia)13.0 3.0
1 For the 30 June 2015 actuarial calculation, salary increases of 2.1 per cent in year 1 and year 2 and 3 per cent for the remaining duration of the plan were assumed. For the 30 June 2014
actuarial calculation, nil salary increase in year 2 and year 3 and three per cent in all other years for the remaining duration of the Plan were assumed.
The expected long-term rate of return is based on the weighted average of expected returns on each individual asset class where the
weightings reflect the proportion of defined benefit assets invested in each asset class. Each asset class’ expected return is based
on expectations of average returns over the next 10 years.
The weighted average duration of the QSP’s defined benefit obligation as at 30 June 2015 was 10 years (2014: 12.6 years).
The sensitivity of the defined benefit obligation to changes in the significant assumption is as follows:
Impact on Defined Benefit Obligation
30 June 2015 30 June 2014
Change in Assumption Increase in Assumption Decrease in Assumption Increase in Assumption Decrease in Assumption
Discount rate 1% Decrease by 11.3% Increase by 13.3% Decrease by 11.5% Increase by 11.6%
Future salary increase 1% Increase by 10.6% Decrease by 9.3% Increase by 10.3% Decrease by 10.7%
Defined contribution fund
The Qantas Group’s results include $165 million (2014: $173 million) of expenses in relation to defined contribution funds.