Qantas 2015 Annual Report Download - page 17
Download and view the complete annual report
Please find page 17 of the 2015 Qantas annual report below. You can navigate through the pages in the report by either clicking on the pages listed below, or by using the keyword search tool below to find specific information within the annual report.-
 1
1 -
2
-
3
-
4
-
5
-
6
-
 7
7 -
 8
8 -
 9
9 -
 10
10 -
 11
11 -
 12
12 -
 13
13 -
 14
14 -
 15
15 -
 16
16 -
 17
17 -
 18
18 -
 19
19 -
 20
20 -
 21
21 -
 22
22 -
 23
23 -
 24
24 -
 25
25 -
 26
26 -
 27
27 -
28
-
29
-
30
-
31
-
32
-
33
-
34
-
35
-
36
-
37
-
38
-
39
-
40
-
41
-
42
-
43
-
44
-
45
-
46
-
47
-
48
-
49
-
50
-
51
-
52
-
53
-
54
-
55
-
56
-
57
-
58
-
59
-
60
-
61
-
62
-
63
-
64
-
65
-
66
-
67
-
68
-
69
-
70
-
71
-
72
-
73
-
74
-
75
-
76
-
77
-
78
-
79
-
80
-
81
-
82
-
83
-
84
-
85
-
86
-
87
-
88
-
89
-
90
-
91
-
92
-
93
-
94
-
95
-
96
-
97
-
98
-
99
-
100
-
101
-
102
-
103
-
104
-
105
-
106
 |
 |
16
QANTAS ANNUAL REPORT 2015
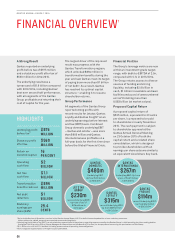
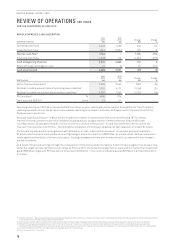
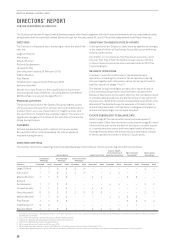
RAPIDLY IMPROVED CASH GENERATION
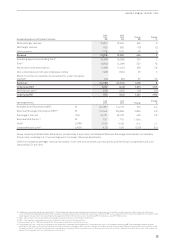
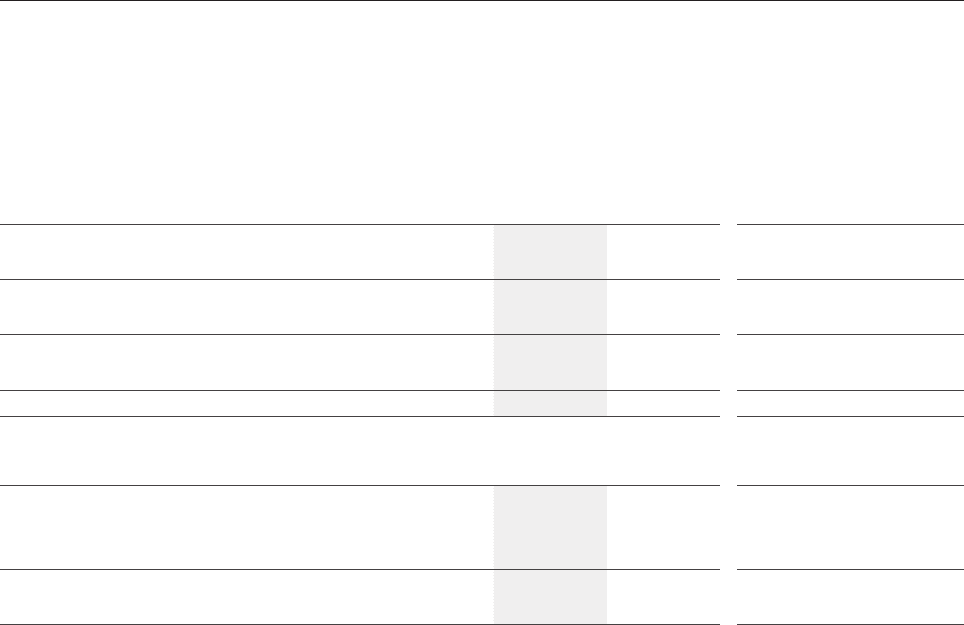
Cash Flow Summary
June
2015
$M
June
2014
$M
Change
$M
Change
%
Operating cash flows 2,048 1,069 979 92
Investing cash flows (944) (1,069) 125 12
Net free cash flow31 1,10 4 –1,10 4 >100
Financing cash flows (1,218) 173 (1,391) >(100)
Cash at beginning of period 3,001 2,829 172 6
Effect of foreign exchange on cash 21 (1) 22 >10 0
Cash at period end 2,908 3,001 (93) (3)
Debt Analysis
June
2015
$M
June
2014
$M
Change
$M
Change
%
Net on balance sheet debt32 2,558 3,455 (897) (26)
Net debt including present value of operating lease liabilities93,742 4,751 (1,009) (21)
Net debt including capitalised operating lease liabilities33 6,306 7, 34 3 (1,037) (14)
FFO/net debt34 %46% 17%
Debt/adjusted EBITDA28 times 2.9 5.1
Operating cash flows of $2 billion almost doubled from the prior year, reflecting benefits realised through Qantas Transformation,
yield improvements across the Group in a more stable operating environment, and lower AUD fuel prices in the second half of the
financial year in particular.
Net cash capital expenditure12 of $944 million included investment in replacement fleet such as the Boeing 787 for Jetstar
International and customer experience initiatives including airport lounges and the commencement of Airbus A330 cabin
reconfigurations. Qantas generated $1.1 billion of net free cash flow in the period – a rapid improvement from the neutral net
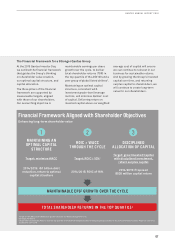
freecash flow outcome in 2013/2014 – facilitating the completion of the Group’s targeted net debt reduction of at least $1 billion.
The Group’s liquidity position strengthened, with $2.9 billion in cash, a $410 million increase35 in available undrawn facilities to
$1billion, and the pool of unencumbered aircraft growing to a total of more than US$3 billion (at market value). Qantas continues to
retain significant flexibility in its financial position, funding strategies and fleet plan to ensure that it can respond to any change in
market conditions.
As a result of improved earnings through the achievement of milestones under the Qantas Transformation program, the Group is now
within the target optimal capital structure range. At 30 June 2015, the Group’s leverage metrics were within or better than investment
grade (BBB/Baa range) with FFO/net debt of 46 per cent (2013/2014: 17 per cent) and Debt/adjusted EBITDA of 2.9times(2013/2014:
5.1 times).
REVIEW OF OPERATIONS CONTINUED
FOR THE YEAR ENDED 30 JUNE 2015
31 Net free cash flow – operating cash flows less investing cash flows. Net free cash flow is a measure of the amount of operating cash flows that are available (i.e. after investing activities)
to fund reductions in net debt or payments to shareholders
32 Net on balance sheet debt includes interest-bearing liabilities and the fair value of hedges related to debt reduced by cash and cash equivalents and aircraft security deposits
33 Net debt including operating lease liability under the Group’s Financial Framework includes net on balance sheet debt and off balance sheet aircraft operating lease liabilities.
Capitalised operating lease liability is measured at fair value at the lease commencement date and remeasured over lease term on a principal and interest basis akin to a finance lease
34 Funds From Operations (FFO) to net debt based on Standard and Poor’s methodology
35 From 30 June 2014 to 7 July 2015