Qantas 2015 Annual Report Download - page 39
Download and view the complete annual report
Please find page 39 of the 2015 Qantas annual report below. You can navigate through the pages in the report by either clicking on the pages listed below, or by using the keyword search tool below to find specific information within the annual report.-
 1
1 -
2
-
3
-
4
-
5
-
6
-
7
-
8
-
9
-
10
-
11
-
12
-
13
-
14
-
15
-
16
-
17
-
18
-
19
-
20
-
21
-
22
-
23
-
24
-
25
-
26
-
27
-
28
-
 29
29 -
 30
30 -
 31
31 -
 32
32 -
 33
33 -
 34
34 -
 35
35 -
 36
36 -
 37
37 -
 38
38 -
 39
39 -
 40
40 -
 41
41 -
 42
42 -
 43
43 -
 44
44 -
 45
45 -
 46
46 -
 47
47 -
 48
48 -
 49
49 -
50
-
51
-
52
-
53
-
54
-
55
-
56
-
57
-
58
-
59
-
60
-
61
-
62
-
63
-
64
-
65
-
66
-
67
-
68
-
69
-
70
-
71
-
72
-
73
-
74
-
75
-
76
-
77
-
78
-
79
-
80
-
81
-
82
-
83
-
84
-
85
-
86
-
87
-
88
-
89
-
90
-
91
-
92
-
93
-
94
-
95
-
96
-
97
-
98
-
99
-
100
-
101
-
102
-
103
-
104
-
105
-
106
 |
 |
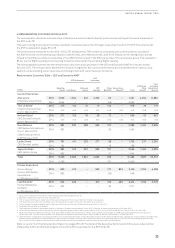
38
QANTAS ANNUAL REPORT 2015
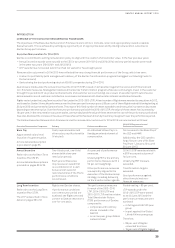
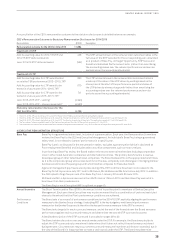
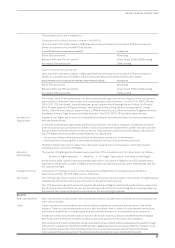
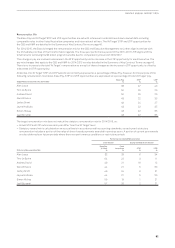
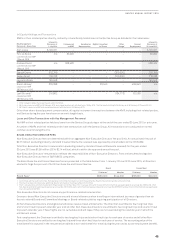
Superannuation
Superannuation includes statutory and salary sacrifice superannuation contributions and is disclosed as a
post-employment benefit.
Other Long-term
Benefits
The movement in accrual of annual leave and long service leave is included in other long-term benefits. The
accounting value of other long-term benefits may be negative, for example where an Executive’s annual leave
balance decreases as a result of taking more than the 20 days annual leave they accrued during the year.
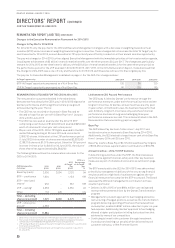
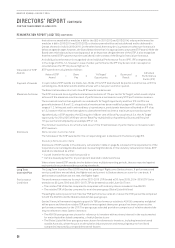
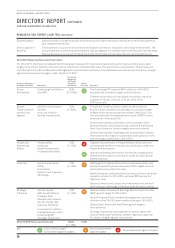
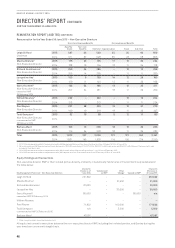
2014/2015 Balanced Scorecard Outcomes
For 2014/2015, the Board considered the following key measures of financial and operational performance and the associated
targets to be critical indicators of performance and drivers of shareholder value. The performance outcomes for these measures
are reflected in the CEO and Executive Management’s remuneration outcomes. The table below summarises performance vs target
against each scorecard category under the 2014/15 STIP.
Scorecard Category /
Strategic Objective Measures
Scorecard
Weighting
‘At Target’
(Range of
Outcomes)
Actual
Outcome Comment
Group
Profitability
Underlying Profit Before
Tax (PBT)
50%
(0–100%)
The Underlying PBT result of $975 million for 2014/2015
exceeded the ‘overdrive’ target set by the Board.
Therefore this measure contributed a maximum overdrive
outcome of 100 per cent (out of 50 per cent) to the
STIPScorecard.
Qantas
Transformation
and the Cost
Agenda
Deliver transformation
benefits
Unit Cost Yield (for
Qantas International)
20%
(0–30%)
The Qantas Transformation to date has delivered over
$1,000 million of benefits, exceeding the cumulative target
of $800 million announced to the market in May 2014. This
also exceeded the revised benefits forecast of $875 million
announced in February 2015.
Qantas International achieved its Unit Cost target, while
Qantas Domestic and Jetstar Group achieved the threshold
level of performance, stretch targets were not achieved.
Qantas International Yield target was exceeded with Qantas
International returning to a sustainable profit position in line
with the target established in 2011/2012.
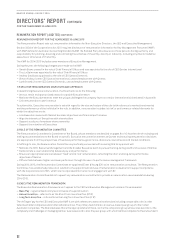
People and
Operational
Safety
People Safety
measures
Board’s assessment
of Operational Safety
10%
(0–15%)
Targeted improvements in People Safety metrics were not
achieved and therefore there was no contribution under the
People Safety measure.
Operational Safety performance for the year was good and
therefore there was full contribution under the Operational
Safety measure.
Customer Net Promoter Score
(NPS)
Punctuality
Network and frequency
advantage
10%
(0–15%)
NPS targets for Qantas International, Qantas Domestic and
Qantas Frequent Flyer were exceeded. NPS targets were not
achieved for some Jetstar brands.
Qantas Domestic continued to be the most on-time of the major
domestic airlines for 2014/2015, with over 88.3 per cent of
flights on-time.
Qantas Domestic and Jetstar also maintained their network
andfrequency advantage in the Australian domestic market.
Strategic
Initiatives
Qantas Loyalty:
EBIT Growth Qantas
Frequent Flyer
Membership numbers
Qantas Loyalty new
business initiatives
Investments in Jetstar-
branded airlines in Asia
Underlying EBIT
Strategic milestones
10%
(0–15%)
Qantas Loyalty achieved its Earnings Before Interest and Tax
(EBIT) growth target for 2014/2015.
Qantas Frequent Flyer membership targets were achieved
withmore than 700,000 new members joining in 2014/2015.
Qantas Cash, Aquire and Red Planet growth targets
wereachieved.
Strategic milestones around growth of Jetstar Japan and
Jetstar Pacific were achieved, however regulatory approval
for Jetstar Hong Kong was not achieved.
2014/15 STIP Scorecard Outcome 100%
(0–175%)
140%
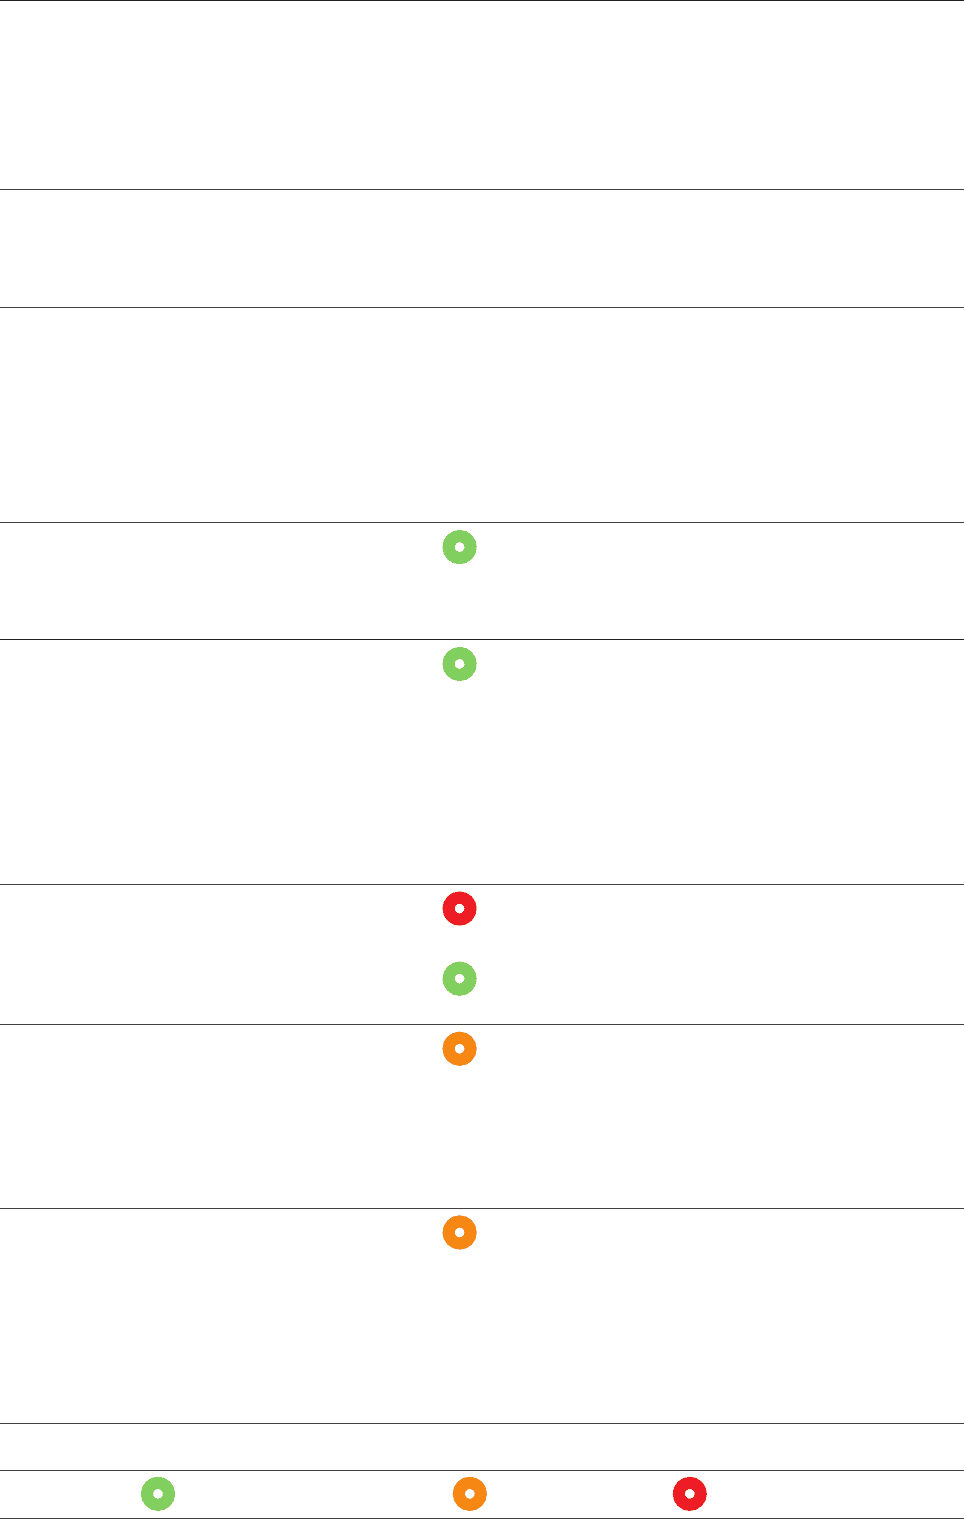
Key:
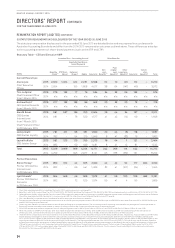
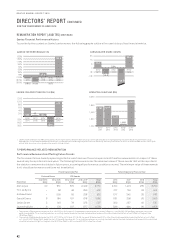
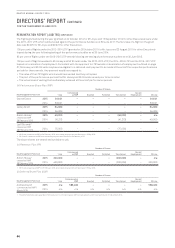
DIRECTORS’ REPORT CONTINUED
FOR THE YEAR ENDED 30 JUNE 2015
REMUNERATION REPORT (AUDITED) CONTINUED
Full (or above target)
achievement against targets
Partial achievement
against targets No achievements against targets