Qantas 2015 Annual Report Download - page 52
Download and view the complete annual report
Please find page 52 of the 2015 Qantas annual report below. You can navigate through the pages in the report by either clicking on the pages listed below, or by using the keyword search tool below to find specific information within the annual report.-
 1
1 -
2
-
3
-
4
-
5
-
6
-
7
-
8
-
9
-
10
-
11
-
12
-
13
-
14
-
15
-
16
-
17
-
18
-
19
-
20
-
21
-
22
-
23
-
24
-
25
-
26
-
27
-
28
-
29
-
30
-
31
-
32
-
33
-
34
-
35
-
36
-
37
-
38
-
39
-
40
-
41
-
 42
42 -
 43
43 -
 44
44 -
 45
45 -
 46
46 -
 47
47 -
 48
48 -
 49
49 -
 50
50 -
 51
51 -
 52
52 -
 53
53 -
 54
54 -
 55
55 -
 56
56 -
 57
57 -
 58
58 -
 59
59 -
 60
60 -
 61
61 -
 62
62 -
63
-
64
-
65
-
66
-
67
-
68
-
69
-
70
-
71
-
72
-
73
-
74
-
75
-
76
-
77
-
78
-
79
-
80
-
81
-
82
-
83
-
84
-
85
-
86
-
87
-
88
-
89
-
90
-
91
-
92
-
93
-
94
-
95
-
96
-
97
-
98
-
99
-
100
-
101
-
102
-
103
-
104
-
105
-
106
 |
 |

51
QANTAS ANNUAL REPORT 2015
Qantas Group
2015
$M
2014
$M
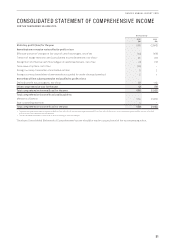
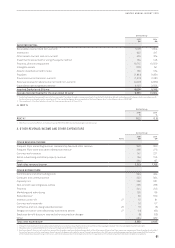
Statutory profit/(loss) for the year 560 (2,843)
Items that are or may be reclassified to profit or loss
Effective portion of changes in fair value of cash flow hedges, net of tax (44) (106)
Transfer of hedge reserve to the Consolidated Income Statement, net of tax191 (70)
Recognition of effective cash flow hedges on capitalised assets, net of tax (2) (19)
Time value of options, net of tax2(95) –
Foreign currency translation of controlled entities 5 2
Foreign currency translation of investments accounted for under the equity method 5 1
Items that will not subsequently be reclassified to profit or loss
Defined benefit actuarial gains, net of tax 38 113
Other comprehensive loss for the year (2) (79)
Total comprehensive income/(loss) for the year 558 (2,922)
Total comprehensive income/(loss) attributable to:
Members of Qantas 554 (2,922)
Non-controlling interests 4 –
Total comprehensive income/(loss) for the year 558 (2,922)
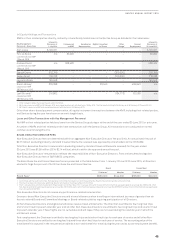
1 These amounts were allocated to revenue of $(40) million (2014: $(110) million), fuel expenditure of $170 million (2014: $10 million), and income tax expense of $(39) million (2014: $30
million) in the Consolidated Income Statement.
2 The net fair value movement in time value of options relating to cash flow hedges.
The above Consolidated Statement of Comprehensive Income should be read in conjunction with the accompanying notes.
CONSOLIDATED STATEMENT OF COMPREHENSIVE INCOME
FOR THE YEAR ENDED 30 JUNE 2015