Qantas 2015 Annual Report Download - page 18
Download and view the complete annual report
Please find page 18 of the 2015 Qantas annual report below. You can navigate through the pages in the report by either clicking on the pages listed below, or by using the keyword search tool below to find specific information within the annual report.-
 1
1 -
2
-
3
-
4
-
5
-
6
-
7
-
 8
8 -
 9
9 -
 10
10 -
 11
11 -
 12
12 -
 13
13 -
 14
14 -
 15
15 -
 16
16 -
 17
17 -
 18
18 -
 19
19 -
 20
20 -
 21
21 -
 22
22 -
 23
23 -
 24
24 -
 25
25 -
 26
26 -
 27
27 -
 28
28 -
29
-
30
-
31
-
32
-
33
-
34
-
35
-
36
-
37
-
38
-
39
-
40
-
41
-
42
-
43
-
44
-
45
-
46
-
47
-
48
-
49
-
50
-
51
-
52
-
53
-
54
-
55
-
56
-
57
-
58
-
59
-
60
-
61
-
62
-
63
-
64
-
65
-
66
-
67
-
68
-
69
-
70
-
71
-
72
-
73
-
74
-
75
-
76
-
77
-
78
-
79
-
80
-
81
-
82
-
83
-
84
-
85
-
86
-
87
-
88
-
89
-
90
-
91
-
92
-
93
-
94
-
95
-
96
-
97
-
98
-
99
-
100
-
101
-
102
-
103
-
104
-
105
-
106
 |
 |

17
QANTAS ANNUAL REPORT 2015
FLEET
The Qantas Group remains committed to a fleet strategy that provides for long-term flexibility and renewal, and that prioritises
Group fleet simplification. The fleet strategy is designed to support the strategic objectives of the Group’s two flying brands and the
overarching targets of the Qantas Transformation program. At all times, the Group retains significant flexibility to respond to any
changes in market conditions and the competitive environment.
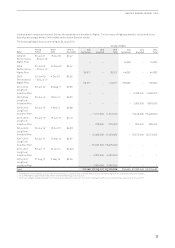
At 30 June 2015, the Qantas Group fleet36 totalled 299 aircraft. During 2014/2015, the Group purchased 11 aircraft and leased
oneaircraft:
–Qantas – five B737–800s, one Bombardier Q400 and one Fokker100
–Jetstar (including Jetstar Asia) – four B787–8s and one A320–200
The Group removed 21 aircraft from service in 2014/2015 including three lease returns. These included 13 B767–300s, one B747–400,
three A320–200s, one Q300 and three EMB120s.
The Qantas Group’s scheduled passenger fleet average age is now 7.7 years37, below the targeted 8–10 year range. The benefits of
fleet investment include improved customer satisfaction, environmental outcomes, operational efficiencies and cost reductions.
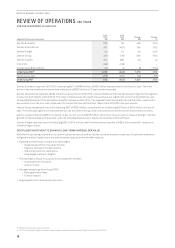
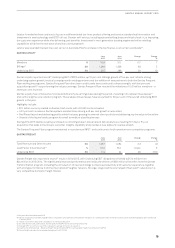
QANTAS DOMESTIC
June
2015
June
2014
Change Change
%
Total Revenue and Other Income $M 5,828 5,848 (20) (0.3)
Revenue Seat Factor %74.2 73.3 0.9 pts
Underlying EBIT $M 480 30 450 >10 0
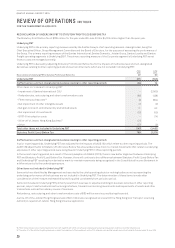
Qantas Domestic reported a robust Underlying EBIT of $480 million, an improvement of $450 million on the prior year. The result
was driven by $302 million of Transformation benefits. Revenue per ASK38 increased 4.5 per cent, offsetting a decline in third
party revenue following the sale of Qantas Defence Services in February 2014. The revenue per ASK was driven by yield and load
improvements in a stabilised domestic market. Comparable unit cost39 for the full year decreased by four per cent with three
percentlower capacity compared to 2013/2014.
Network changes and dynamic capacity management supported yield gains in a mixed demand environment. New services and
frequencies were added on East Coast leisure markets, while Qantas Domestic continued to right-size its intra-Western Australia
and Queensland footprint in response to ongoing demand weakness from the resources sector. Better matching of capacity
to demand on thin domestic routes, such as Hobart and Canberra, has also delivered improved revenue per ASK and restored
profitability on these markets.
With mainline fleet simplification complete, Qantas Domestic now operates one common narrowbody aircraft type (B738) and one
widebody type (A330–200). Focus continues on network optimisation and increased utilisation to generate a stronger return from
Invested Capital. The introduction of reduced turn times for the B738 fleet resulted in improved utilisation in the second half of
2014/2015.
Qantas Domestic increased on-time performance over the year to 88.3 per cent with the best on-time performance40 result in over
ten years. With ongoing investment in the customer experience and service training for our people, customer advocacy measured
byNet Promoter Score increased to a record41 in 2014/2015.
36 Includes Jetstar Asia, Qantas Freight and Network Aviation and excludes aircraft owned by Jetstar Japan, Jetstar Hong Kong and Jetstar Pacific
37 Based on Group’s scheduled passenger fleet, excluding Freighter aircraft and Network Aviation
38 Calculated as passenger revenue per ASK
39 Comparable unit cost is calculated as Underlying EBIT less passenger revenue and fuel adjusted for changes in discount rates, foreign exchange rates and movements in average sector
lengths per ASK. If adjusted for the impact of the carbon tax repeal, comparable unit cost improved one per cent.
40 On-time performance for Qantas mainline. Source: BITRE
41 Net promoter score, based on internal Qantas reporting (record achieved in June 2015)