Qantas 2015 Annual Report Download - page 62
Download and view the complete annual report
Please find page 62 of the 2015 Qantas annual report below. You can navigate through the pages in the report by either clicking on the pages listed below, or by using the keyword search tool below to find specific information within the annual report.-
 1
1 -
2
-
3
-
4
-
5
-
6
-
7
-
8
-
9
-
10
-
11
-
12
-
13
-
14
-
15
-
16
-
17
-
18
-
19
-
20
-
21
-
22
-
23
-
24
-
25
-
26
-
27
-
28
-
29
-
30
-
31
-
32
-
33
-
34
-
35
-
36
-
37
-
38
-
39
-
40
-
41
-
42
-
43
-
44
-
45
-
46
-
47
-
48
-
49
-
50
-
51
-
 52
52 -
 53
53 -
 54
54 -
 55
55 -
 56
56 -
 57
57 -
 58
58 -
 59
59 -
 60
60 -
 61
61 -
 62
62 -
 63
63 -
 64
64 -
 65
65 -
 66
66 -
 67
67 -
 68
68 -
 69
69 -
 70
70 -
 71
71 -
 72
72 -
73
-
74
-
75
-
76
-
77
-
78
-
79
-
80
-
81
-
82
-
83
-
84
-
85
-
86
-
87
-
88
-
89
-
90
-
91
-
92
-
93
-
94
-
95
-
96
-
97
-
98
-
99
-
100
-
101
-
102
-
103
-
104
-
105
-
106
 |
 |
61
QANTAS ANNUAL REPORT 2015
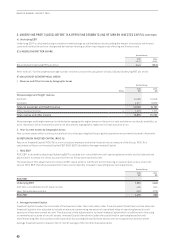
Qantas Group
2015
$M
2014
$M
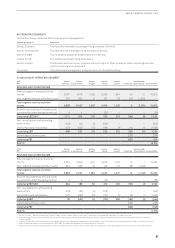
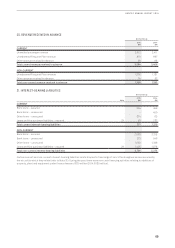
INVESTED CAPITAL
Receivables (current and non-current) 1,093 1,354
Inventories 322 317
Other assets (current and non-current) 424 374
Investments accounted for using the equity method 134 143
Property, plant and equipment 10,715 10,500
Intangible assets 803 741
Assets classified as held for sale 136 134
Payables (1,881) (1,851)
Provisions (current and non-current) (1,213) (1,281)
Revenue received in advance (current and non-current) (4,943) (4,589)
Capitalised operating leased assets13,100 3,553
Invested Capital as at 30 June 8,690 9,395
Average Invested Capital for the year ended 30 June29,091 13,004
1 Capitalised operating lease assets are initially measured at fair value at lease commencement date (translated to Australian dollars) and subsequently depreciated in accordance with
the Group’s accounting policies for owned aircraft. The calculated depreciation is reported as ‘Notional Depreciation’ in the determination of ROIC EBIT.
2 The impairment of the Qantas International CGU was recognised as at 30 June 2014.
iii. ROIC %
Qantas Group
2015
%
2014
%
ROIC %116.2 (1.5)
1 ROIC % is calculated as Return on Invested Capital EBIT (ROIC EBIT) divided by Average Invested Capital.
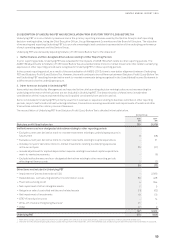
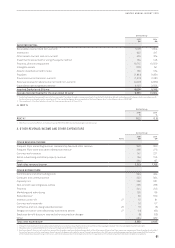
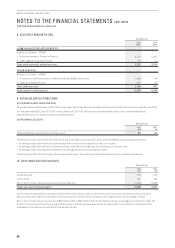
4. OTHER REVENUE/INCOME AND OTHER EXPENDITURE
Qantas Group
Notes
2015
$M
2014
$M
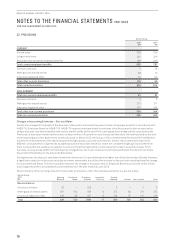
OTHER REVENUE/INCOME
Frequent Flyer marketing revenue, membership fees and other revenue 348 300
Frequent Flyer store and other redemption revenue1286 275
Contract work revenue 141 227
Retail, advertising and other property revenue 154 156
Other 284 197
Total other revenue/income 1,213 1,155
OTHER EXPENDITURE
Commissions and other selling costs 544 494
Computer and communication 400 394
Capacity hire 292 331
Non-aircraft operating lease rentals 235 238
Property 244 245
Marketing and advertising 103 86
Redundancies260 370
Inventory write-off 27 10 61
Contract work materials 16 57
Ineffective and non-designated derivatives 26 13 (8)
Net gain on sale of controlled entity and related assets 27 (11) (62)
Employee benefit discount rate and other assumption changes (8) (53)
Other 464 482
Total other expenditure32,362 2,635
1 Frequent Flyer redemption revenue excludes redemptions on Qantas Group flights which are reported as net passenger revenue in the Consolidated Income Statement.
2 Redundancies include defined benefit curtailment expenses of $5 million (2014: $36 million).
3 Employee benefit discount rate and other assumption changes have been disclosed separately within other expenditure rather than manpower expenses as these changes do not reflect
the current service costs for employees. Airport security charges are included in aircraft operating variable costs. Selling and marketing expenses have been separately disclosed as
either marketing and advertising, commissions and other selling costs or other expenditure. The comparative for 30 June 2014 has been restated to enable comparability.