Qantas 2015 Annual Report Download - page 16
Download and view the complete annual report
Please find page 16 of the 2015 Qantas annual report below. You can navigate through the pages in the report by either clicking on the pages listed below, or by using the keyword search tool below to find specific information within the annual report.-
 1
1 -
2
-
3
-
4
-
5
-
 6
6 -
 7
7 -
 8
8 -
 9
9 -
 10
10 -
 11
11 -
 12
12 -
 13
13 -
 14
14 -
 15
15 -
 16
16 -
 17
17 -
 18
18 -
 19
19 -
 20
20 -
 21
21 -
 22
22 -
 23
23 -
 24
24 -
 25
25 -
 26
26 -
27
-
28
-
29
-
30
-
31
-
32
-
33
-
34
-
35
-
36
-
37
-
38
-
39
-
40
-
41
-
42
-
43
-
44
-
45
-
46
-
47
-
48
-
49
-
50
-
51
-
52
-
53
-
54
-
55
-
56
-
57
-
58
-
59
-
60
-
61
-
62
-
63
-
64
-
65
-
66
-
67
-
68
-
69
-
70
-
71
-
72
-
73
-
74
-
75
-
76
-
77
-
78
-
79
-
80
-
81
-
82
-
83
-
84
-
85
-
86
-
87
-
88
-
89
-
90
-
91
-
92
-
93
-
94
-
95
-
96
-
97
-
98
-
99
-
100
-
101
-
102
-
103
-
104
-
105
-
106
 |
 |

15
QANTAS ANNUAL REPORT 2015
QANTAS TRANSFORMATION – DELIVERING AGAINST A BALANCED SCORECARD
The accelerated Qantas Transformation program is targeting the delivery of $2 billion of gross benefits by the end of financial year
2016/2017, with all milestones to date having been met or exceeded. Within the $2 billion target, the program is sized and structured
to achieve important strategic outcomes.
Strategic outcomes by 2016/2017 include:
–Group ex-fuel expenditure reduced by > 10 per cent23
–Qantas Domestic unit cost gap24 to competitor to close to < five per cent
–Qantas International unit cost comparable to direct competitors
–Jetstar lowest seat cost and yield advantage maintained
–Consistent and improved customer experience
–Embedded culture of transformation for ongoing benefits beyond 2016/2017
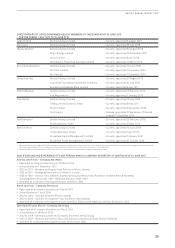
The target metrics and achievements to date as at 2014/2015 include:
Achieving Our Targets Target Metric Achievements to Date
Accelerated transformation benefits $2 billion gross benefits
Group ex-fuel expenditure reduced by
> 10 per cent25
5,000 FTE reduction
$1.1 billion cost and revenue benefits
realised
Ex-fuel expenditure26 reduced by
sixpercent
Reduction of 4,00027 full time equivalent
staff out of targeted 5,000 reduction by
2016/2017
De-leverage balance sheet Greater than $1 billion debt reduction $1.1 billion of net debt reduction since
financial year 2012/2013
Debt/EBITDA <4 times Debt / adjusted EBITDA28 of 2.9 times,
meeting leverage target of Debt / adjusted
EBITDA < 4 times two years ahead of
schedule
Cash flow Sustainable positive free cash flow $1.1 billion net free cash flow in FY15
Fleet simplification 11 fleet types to seven Group fleet types (excluding regional
operations) reduced from 11 to nine with the
exit of B734 and B767. In addition, four out of
six non-reconfigured B747 aircraft retired29
Customer and brand Customer satisfaction
(six month rolling average)
Most on-time domestic carrier:
QantasDomestic
Customer satisfaction at record levels
andimproving
Most on-time domestic departures and
arrivals in 2014/201530
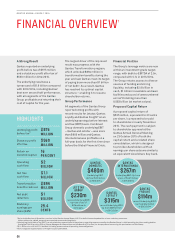
With $1.1 billion of benefits having been realised to date, the Group expects to realise Qantas Transformation benefits of $450 million
in 2015/2016.
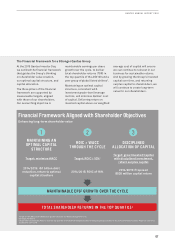
The Group-wide policy of implementing an 18-month wages freeze, whilst not part of the $2 billion Qantas Transformation Program, is
helping to offset inflation and build a more competitive and sustainable wages position. Eighteen agreements have been closed with
the wages freeze, with all of the major unions representing employee groups having signed up to the policy in at least one agreement.
In July 2015, Qantas announced that employees covered by the wages freeze policy will receive a one-off bonus payment worth five
per cent of base annual salary.
23 Target assumes steady foreign exchange rates, capacity and sector length
24 Unit cost is calculated as Underlying EBIT less passenger revenue per ASK. Qantas Domestic unit cost includes QantasLink. Competitor refers to Virgin Australia including mainline
domestic and regional operations. Virgin’s assumed domestic unit cost is based on Qantas’ internal estimates and published competitor data
25 Compared to first-half ended 31 December 2013, annualised and assuming steady foreign exchange rates, capacity and sector length
26 Includes Underlying operating expenses (including fuel), depreciation and amortisation (excluding depreciation reduction from Qantas International non-cash fleet impairment) and
non-cancellable operating lease rentals
27 Exited FTEs as at 30 June 2015
28 Metric calculated based on Moody’s methodology
29 From December 2013 to August 2015
30 Qantas mainline compared with Virgin mainline. Source: BITRE