Qantas 2015 Annual Report Download - page 15
Download and view the complete annual report
Please find page 15 of the 2015 Qantas annual report below. You can navigate through the pages in the report by either clicking on the pages listed below, or by using the keyword search tool below to find specific information within the annual report.-
 1
1 -
2
-
3
-
4
-
 5
5 -
 6
6 -
 7
7 -
 8
8 -
 9
9 -
 10
10 -
 11
11 -
 12
12 -
 13
13 -
 14
14 -
 15
15 -
 16
16 -
 17
17 -
 18
18 -
 19
19 -
 20
20 -
 21
21 -
 22
22 -
 23
23 -
 24
24 -
 25
25 -
26
-
27
-
28
-
29
-
30
-
31
-
32
-
33
-
34
-
35
-
36
-
37
-
38
-
39
-
40
-
41
-
42
-
43
-
44
-
45
-
46
-
47
-
48
-
49
-
50
-
51
-
52
-
53
-
54
-
55
-
56
-
57
-
58
-
59
-
60
-
61
-
62
-
63
-
64
-
65
-
66
-
67
-
68
-
69
-
70
-
71
-
72
-
73
-
74
-
75
-
76
-
77
-
78
-
79
-
80
-
81
-
82
-
83
-
84
-
85
-
86
-
87
-
88
-
89
-
90
-
91
-
92
-
93
-
94
-
95
-
96
-
97
-
98
-
99
-
100
-
101
-
102
-
103
-
104
-
105
-
106
 |
 |

14
QANTAS ANNUAL REPORT 2015
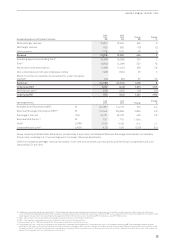
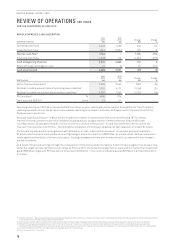
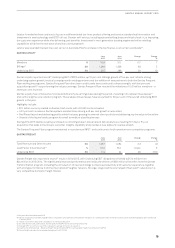
Segment Performance Summary
June
2015
$M
June
2014
$M
Change
$M
Change
%
Qantas Domestic 480 30 450 >10 0
Qantas International 267 (497) 764 >100
Qantas Freight 114 24 90 >100
Jetstar Group 230 (116) 346 >10 0
Qantas Loyalty 315 286 29 10
Corporate (163) (163) – –
Unallocated/Eliminations (10) (4) (6) >(100)
Underlying EBIT11,233 (440) 1,673 >100
Net finance costs (258) (206) (52) (25)
Underlying PBT1975 (646) 1,621 >100
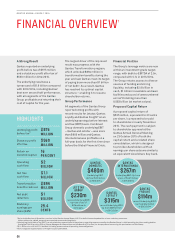
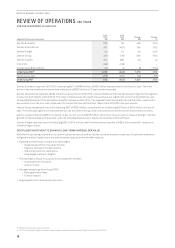
Qantas Domestic reported 2014/2015 Underlying EBIT of $480 million, a $450 million improvement from the prior year. The main
driver of the improved performance was realisation of $302 million of Transformation benefits.
Qantas International reported a $764 million turnaround from 2013/2014, a major milestone that met the Group’s target for the segment
to return to profitability in 2014/2015. This major milestone was the result of several years of significant restructuring initiatives, and
included $408 million of Transformation benefits realised in 2014/2015. The segment result benefited from a $195 million reduction in
depreciation from the non-cash impairment to the Qantas International fleet taken in the 2013/2014 full year results.
Jetstar Group recognised a record Underlying EBIT of $230 million, compared to an Underlying EBIT loss of $116 million in the prior
year. This reflected significant improvement across the Jetstar Group, with continued cost transformation and revenue recovery.
Qantas Loyalty Underlying EBIT increased 10 per cent to a record $315 million, driven by a five per cent increase in billings21 and the
growth of new and adjacent business ventures including Qantas Cash, Aquire, Accumulate and Red Planet.
Qantas Freight reported record Underlying EBIT of $114 million, with Transformation benefits of $38 million and yield22 reductions
offset by higher loads.
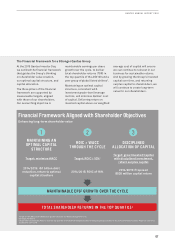
DISCIPLINED INVESTMENT TO ENHANCE LONG-TERM SHAREHOLDER VALUE
With the Group having returned to its optimal capital structure, and no further net debt reduction required, disciplined investment
will grow Invested Capital over time and maximise long-term shareholder value by:
–Building on the Group’s competitive advantages
• Integrated portfolio of premier brands
• Superior domestic market position
• Improving customer experience
• Leveraging customer insights
–Positioning the Group to succeed in future growth markets
• Loyalty growth initiatives
• Jetstar in Asia
–Strengthening long-term Group ROIC
• Next-generation fleet
• Transformation
–Aligning with our brand values and vision
REVIEW OF OPERATIONS CONTINUED
FOR THE YEAR ENDED 30 JUNE 2015
21 Billings represent point sales to partners
22 Yield is calculated as freight revenue excluding foreign exchange divided by revenue freight tonne kilometres (RFTKs)