Qantas 2015 Annual Report Download - page 43
Download and view the complete annual report
Please find page 43 of the 2015 Qantas annual report below. You can navigate through the pages in the report by either clicking on the pages listed below, or by using the keyword search tool below to find specific information within the annual report.
42
QANTAS ANNUAL REPORT 2015
REMUNERATION REPORT (AUDITED) CONTINUED
Qantas Financial Performance History
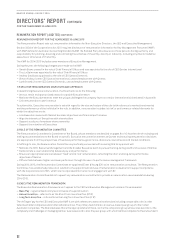
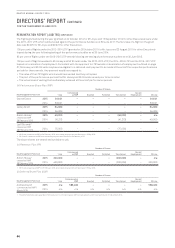
To provide further context on Qantas’ performance, the following graphs outline a five-year history of key financial metrics.
1 Underlying Profit Before Tax (PBT) is the primary reporting measure used by the Qantas Group’s chief operating decision-making bodies, being the Chief Executive Officer, Group
Management Committee and the Board of Directors, for the purpose of assessing the performance of the Group. Statutory Profit After Tax for 2014/2015 was $560 million (2014: ($2.8)
billion, 2013: $2 million, 2012: ($244) million and 2011: $249 million).
7) PERFORMANCE-RELATED REMUNERATION
Performance Remuneration Affecting Future Periods
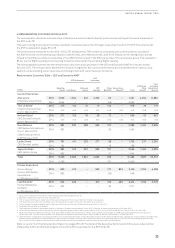
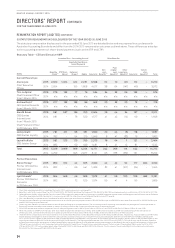
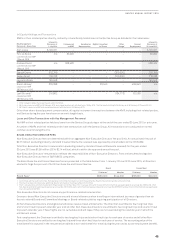
The fair value of share-based payments granted is amortised over the service period and therefore remuneration in respect of these
awards may be reported in future years. The following table summarises the maximum value of these awards that will be reported in
the statutory remuneration tables in future years, assuming all performance conditions are met. The minimum value of these awards
is nil, should performance conditions not be satisfied.
Future Expense by Plan Future Expense by Financial Year
Deferred Shares LTIP Awards
Executives
2012/2013
$’000
2014/2015
$’000
2014–20161
$’000
2015–20172
$’000
Total
$’000
2016
$’000
2017
$’000
2018
$’000
Total
$’000
Alan Joyce 20 651 670 2,409 3,750 2,102 1,413 235 3,750
Tino La Spina –98 48 256 402 217 159 26 402
Andrew David –599 55 298 952 577 345 30 952
Gareth Evans 6184 197 678 1,065 601 398 66 1,065
Lesley Grant 5140 79 373 597 320 237 40 597
Jayne Hrdlicka 6176 197 677 1,056 596 394 66 1,056
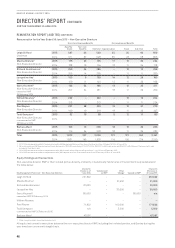
1 The number of Rights granted under the 2014–2016 LTIP on 18 October 2013 were determined using the fair value of a Right on 1 July 2013 ($0.790 per Right), being the start of the
performance period. For accounting purposes, accounting standards require the share-based payment expense to be calculated using the fair value of a Right on the grant date
($0.830per Right).
2 The number of Rights granted under the 2015–2017 LTIP (on 24 October 2014 for Mr Joyce and 15 September 2015 for other Executives) were determined using the fair value of a Right
on 1 July 2014 ($0.785 per Right), being the start of the performance period. For accounting purposes, accounting standards require the share-based payment expense to be calculated
using the fair value of a Right on the grant date ($0.970 per Right for Mr Joyce and $0.972 for other Executives).
DIRECTORS’ REPORT CONTINUED
FOR THE YEAR ENDED 30 JUNE 2015
QANTAS TSR PERFORMANCE (%)
150%
130%
110%
90%
70%
50%
30%
10%
(10%)
(30%)
(50%) (6.7)
150.8
(16.4) (41.6)
25.6
2010/
2011
2011/
2012
2012/
2013
2013/
2014
2014/
2015
600
(600)
400
(400)
200
(200)
800
1,000
1,200
02010/
2011
2011/
2012
UNDERLYING PROFIT BEFORE TAX ($M)
552 95 186
(646)
975
2012/
2013
2013/
2014
2014/
2015 1,300
1,600
1,900
2,200
1,000 2010/
2011
2011/
2012
OPERATING CASHFLOW ($M)
1,782 1,810
1,417
1,069
2,048
2012/
2013
2013/
2014
2014/
2015
0
(5)
5
(15)
15
25
(128.5)
25.4
11.0
(10.8)
0.04
2010/
2011
2011/
2012
2012/
2013
2013/
2014
2014/
2015
EARNINGS PER SHARE (CENTS)


