Qantas 2014 Annual Report Download - page 86
Download and view the complete annual report
Please find page 86 of the 2014 Qantas annual report below. You can navigate through the pages in the report by either clicking on the pages listed below, or by using the keyword search tool below to find specific information within the annual report.-
 1
1 -
2
-
3
-
4
-
5
-
6
-
7
-
8
-
9
-
10
-
11
-
12
-
13
-
14
-
15
-
16
-
17
-
18
-
19
-
20
-
21
-
22
-
23
-
24
-
25
-
26
-
27
-
28
-
29
-
30
-
31
-
32
-
33
-
34
-
35
-
36
-
37
-
38
-
39
-
40
-
41
-
42
-
43
-
44
-
45
-
46
-
47
-
48
-
49
-
50
-
51
-
52
-
53
-
54
-
55
-
56
-
57
-
58
-
59
-
60
-
61
-
62
-
63
-
64
-
65
-
66
-
67
-
68
-
69
-
70
-
71
-
72
-
73
-
74
-
75
-
 76
76 -
 77
77 -
 78
78 -
 79
79 -
 80
80 -
 81
81 -
 82
82 -
 83
83 -
 84
84 -
 85
85 -
 86
86 -
 87
87 -
 88
88 -
 89
89 -
 90
90 -
 91
91 -
 92
92 -
 93
93 -
 94
94 -
 95
95 -
 96
96 -
97
-
98
-
99
-
100
-
101
-
102
-
103
-
104
-
105
-
106
-
107
-
108
-
109
-
110
-
111
-
112
-
113
-
114
-
115
-
116
-
117
-
118
-
119
-
120
-
121
-
122
-
123
-
124
-
125
-
126
-
127
-
128
-
129
-
130
-
131
-
132
 |
 |
84
QANTAS ANNUAL REPORT 2014
NOTES TO THE FINANCIAL STATEMENTS CONTINUED
FOR THE YEAR ENDED 30 JUNE 2014
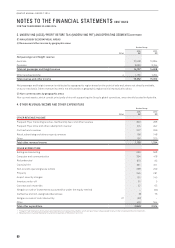
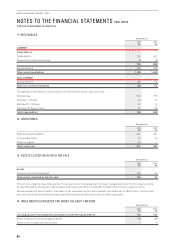
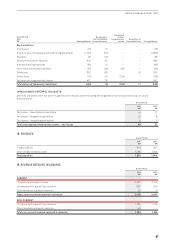
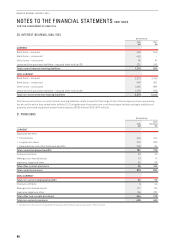
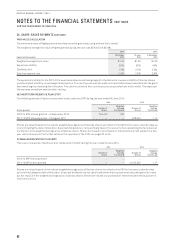
11. RECEIVABLES
Qantas Group
2014
$M
2013
$M
CURRENT
Trade debtors
Trade debtors 739 901
Provision for impairment losses (3) (3)
736 898
Sundry debtors 460 538
Total current receivables 1,19 6 1,436
NON-CURRENT
Sundry debtors 158 174
Total non-current receivables 158 174
The ageing of trade debtors, net of provision for impairment losses, at 30 June was:
Not past due 600 753
Past due 1–30 days 48 77
Past due 31–120 days 67 29
Past due 121 days or more 21 39
Total trade debtors 736 898
12. INVENTORIES
Qantas Group
2014
$M
2013
$M
Engineering expendables 245 301
Consumable stores 52 56
Work in progress 20 7
Total inventories 317 364
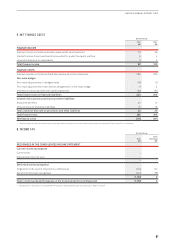
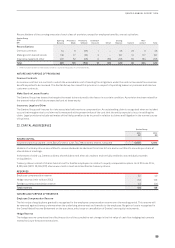
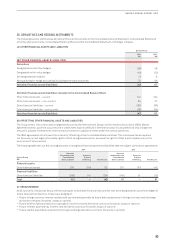
13. ASSETS CLASSIFIED AS HELD FOR SALE
Qantas Group
2014
$M
2013
$M
Assets
Property, plant and equipment 134 42
Total assets classified as held for sale 134 42
The non-recurring fair value measurement for property, plant and equipment has been categorised under the fair value hierarchy
asLevel 3 based on the inputs to the valuation technique used. Refer to Note 36 for a definition of the fair value hierarchy.
Remeasurement of assets held for sale down to fair value less costs to sell resulted in an impairment of $30million. The fair value
less costs to sell for the individual assets was determined with reference to recent sale transactions.
14. INVESTMENTS ACCOUNTED FOR UNDER THE EQUITY METHOD
Qantas Group
2014
$M
2013
$M
Carrying amount of investments accounted for under the equity method 143 190
Share of losses from continuing operations (66) (39)
Share of other comprehensive income 1(1)