Qantas 2014 Annual Report Download - page 81
Download and view the complete annual report
Please find page 81 of the 2014 Qantas annual report below. You can navigate through the pages in the report by either clicking on the pages listed below, or by using the keyword search tool below to find specific information within the annual report.-
 1
1 -
2
-
3
-
4
-
5
-
6
-
7
-
8
-
9
-
10
-
11
-
12
-
13
-
14
-
15
-
16
-
17
-
18
-
19
-
20
-
21
-
22
-
23
-
24
-
25
-
26
-
27
-
28
-
29
-
30
-
31
-
32
-
33
-
34
-
35
-
36
-
37
-
38
-
39
-
40
-
41
-
42
-
43
-
44
-
45
-
46
-
47
-
48
-
49
-
50
-
51
-
52
-
53
-
54
-
55
-
56
-
57
-
58
-
59
-
60
-
61
-
62
-
63
-
64
-
65
-
66
-
67
-
68
-
69
-
70
-
 71
71 -
 72
72 -
 73
73 -
 74
74 -
 75
75 -
 76
76 -
 77
77 -
 78
78 -
 79
79 -
 80
80 -
 81
81 -
 82
82 -
 83
83 -
 84
84 -
 85
85 -
 86
86 -
 87
87 -
 88
88 -
 89
89 -
 90
90 -
 91
91 -
92
-
93
-
94
-
95
-
96
-
97
-
98
-
99
-
100
-
101
-
102
-
103
-
104
-
105
-
106
-
107
-
108
-
109
-
110
-
111
-
112
-
113
-
114
-
115
-
116
-
117
-
118
-
119
-
120
-
121
-
122
-
123
-
124
-
125
-
126
-
127
-
128
-
129
-
130
-
131
-
132
 |
 |

79
QANTAS ANNUAL REPORT 2014
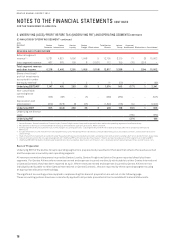
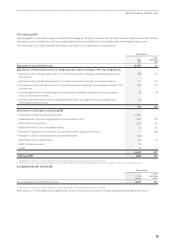
(iii) Underlying EBIT
Underlying EBIT is calculated using a consistent methodology as outlined in the basis of preparation but excluding the impact of statutory
net finance costs and ineffective and non-designated derivatives relating to other reporting periods affecting net finance costs.
The reconciliation of Underlying PBT to Statutory loss before tax is detailed in the table below.
Qantas Group
2014
$M
2013
Restated1
$M
Statutory (loss)/profit before tax (3,976) 11
Adjusted for ineffectiveness and non-designated derivatives relating to other reporting periods
–Exclude current year derivative mark-to-market movements relating to underlying exposures in
future years
(58) 26
–Exclude current year derivative mark-to-market movements relating to capital expenditure 21 12
–Include prior years’ derivative mark-to-market movements relating to underlying exposures in the
current year
(27) (71)
–Include adjustment for implied depreciation expense relating to excluded capital expenditure
mark-to-market movements
(6) (6)
–Exclude ineffectiveness and non-designated derivatives relating to other reporting periods
affecting net finance costs
(2) 7
(72) (32)
Other items not included in Underlying PBT
–Impairment of Qantas International CGU 2,560 –
–Redundancies, restructuring and other transformation costs 428 118
–Fleet restructuring costs2394 90
–Net impairment of other intangible assets 924
–Net gain on disposal of investments accounted for under the equity method –(30)
–Net gain on sale of controlled entity and related assets (62) –
–Net impairment of investments 50 (2)
–B787 introduction costs 14 –
–Other 9 7
3,402 207
Underlying PBT (646) 186
1 Restatement for the impact of revised AASB 119 relating to defined benefit superannuation plans. Refer to Note 38.
2 Fleet restructuring costs including impairment of aircraft, together with other aircraft associated property, plant and equipment, inventory and other related costs.
(E) UNDERLYING PBT PER SHARE
Qantas Group
2014
cents
2013
Restated1
cents
Basic/diluted Underlying PBT per share (29.2) 8.3
1 Restatement for the impact of revised AASB 119 relating to defined benefit superannuation plans. Refer to Note 38.
Refer to Note 7 for the weighted average number of shares used in the calculation of basic/diluted Underlying PBT per share.