Qantas 2014 Annual Report Download - page 36
Download and view the complete annual report
Please find page 36 of the 2014 Qantas annual report below. You can navigate through the pages in the report by either clicking on the pages listed below, or by using the keyword search tool below to find specific information within the annual report.-
 1
1 -
2
-
3
-
4
-
5
-
6
-
7
-
8
-
9
-
10
-
11
-
12
-
13
-
14
-
15
-
16
-
17
-
18
-
19
-
20
-
21
-
22
-
23
-
24
-
25
-
 26
26 -
 27
27 -
 28
28 -
 29
29 -
 30
30 -
 31
31 -
 32
32 -
 33
33 -
 34
34 -
 35
35 -
 36
36 -
 37
37 -
 38
38 -
 39
39 -
 40
40 -
 41
41 -
 42
42 -
 43
43 -
 44
44 -
 45
45 -
 46
46 -
47
-
48
-
49
-
50
-
51
-
52
-
53
-
54
-
55
-
56
-
57
-
58
-
59
-
60
-
61
-
62
-
63
-
64
-
65
-
66
-
67
-
68
-
69
-
70
-
71
-
72
-
73
-
74
-
75
-
76
-
77
-
78
-
79
-
80
-
81
-
82
-
83
-
84
-
85
-
86
-
87
-
88
-
89
-
90
-
91
-
92
-
93
-
94
-
95
-
96
-
97
-
98
-
99
-
100
-
101
-
102
-
103
-
104
-
105
-
106
-
107
-
108
-
109
-
110
-
111
-
112
-
113
-
114
-
115
-
116
-
117
-
118
-
119
-
120
-
121
-
122
-
123
-
124
-
125
-
126
-
127
-
128
-
129
-
130
-
131
-
132
 |
 |

34
QANTAS ANNUAL REPORT 2014
REVIEW OF OPERATIONS CONTINUED
FOR THE YEAR ENDED 30 JUNE 2014
The reduction in Underlying EBIT was driven largely by continued domestic market capacity growth ahead of demand growth and
i
ncreased fuel cost of $68million. Business and leisure demand remained weak throughout the year, with corporate account
revenue impacted by softening resources sector demand, particularly in the Western Australian and Queensland markets and
reduced Government spending. This challenging competitive environment resulted in reduced revenue seat factor and weaker yields.
However, Qantas continues to be the clear choice for business travellers and has maintained over 80 per cent share of corporate
account revenue.
Qantas Domestic’s comparable unit cost6 improved three per cent on the prior corresponding period, as cost savings were realised
from the accelerated Qantas Transformation program. Benefits realised stemmed from initiatives including the consolidation of
Qantas heavy maintenance bases, continued fleet renewal, and the ongoing management and non-operational restructure.
Qantas Domestic achieved record customer satisfaction levels over the year, with a number of industry awards recognising our
product offering and service standards:
–‘Best Domestic Airline’32 five years running
–‘Best Economy’33 noting that Qantas Domestic was the world’s best by a wide margin
–‘Best Lounges’33
–‘Australia’s Favourite Airline’34
Qantas Domestic has achieved superior on-time performance for the fifth year running, including beating its main competitor for an
unprecedented 18 consecutive months to June 2014.
Qantas Domestic continued to strengthen its customer proposition through improved lounge experiences, investing in new and
expanded lounges in Melbourne, Tamworth and Broome airports, and continued investment in front-line team training. Network
growth continues with commencement of new East Coast premium leisure routes: Brisbane to Port Macquarie, Sydney to Hervey Bay,
Melbourne to Coffs Harbour, and Sydney to Hamilton Island.
Qantas Domestic continues to support the regional market position through QantasLink and Network Aviation services. QantasLink
launched two-class B717-200 services on Canberra and Tasmania routes and took delivery of two Bombardier Q400 aircraft and two
B717-200 aircraft during the period. Network Aviation commenced regular passenger transport operations during June. QantasLink
relocated into the Qantas Sydney terminal, creating a more seamless travel experience for Qantas customers through smoother
connections and reduced check-in times.
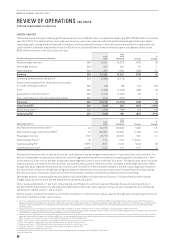
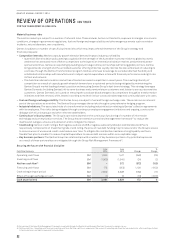
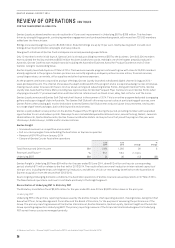
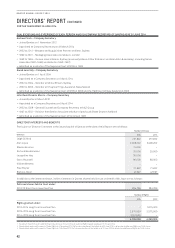
Qantas International
–Market capacity oversupply adversely impacted International market yields and revenue seat factors
–Adverse currency movement increased AUD fuel price
–Comparable unit cost6 improvement of four per cent
–Strengthening alliances through Emirates partnership and new codeshare agreements
–Ongoing product investment to build on recent customer advocacy gains
June
2014
June
2013 Change
%
Change
Total Revenue and Other Income $M 5,297 5,496 (199) (4)
Revenue Seat Factor %79.6 81.6 (2.0) pts
Underlying EBIT $M (497) (246) (251) >(100)
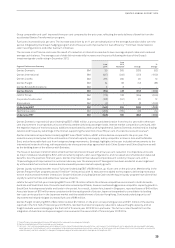
Qantas International Underlying EBIT loss of $497million represents a $251million deterioration on the prior financial year.
Significant benefits from the Qantas Transformation program have been materially offset by lower revenue and the unfavourable
foreign exchange impact on fuel of $42million.
Yields were reduced due to market capacity oversupply, with International capacity in and out of Australia increasing by 9.5 per cent
(or 3.7million additional seats), resulting in an intensely competitive pricing environment. Capacity growth was largely led by Middle
Eastern, Asian network and low-cost carriers. The strength of our alliance with Emirates has provided a partial offset, with a strong
‘one stop’ European proposition and additional frequencies into Asia.
Comparable unit cost improved four per cent. Improved asset utilisation of six per cent, combined with the ongoing restructure of the
legacy cost base through the Qantas Transformation program, has delivered this strong unit cost result. The B747-400 retirement
program (an additional three units in financial year 2013/2014), reduction in heavy maintenance footprint, and improved fleet
economics following the A380-800 and B747-400 reconfiguration program have all made a significant contribution to cost reduction.
Ongoing optimisation of the network remains a key focus area. Recent examples include the exit of Perth-Singapore and down-gauge
of Brisbane-Singapore and Sydney-Singapore to A330 aircraft.
Qantas International continues to invest in what our customers value most, including lounges, with significant improvements to
the Los Angeles and Hong Kong lounges, and onboard product enhancement including menu design and a sleeper service. These,
combined with the broader network proposition through the Emirates alliance, have seen Net Promoter Scores improve a significant
10 points over two years. The launch of the A330 flat bed in late 2014 continues this commitment.
32 Australian Federation of Travel Agents National Industry Awards 2010 – 2014.
33 AirlineRatings.com’s Airline Excellence Awards, January 2014.
34 TripAdvisor Traveller’s Choice Awards.