Qantas 2014 Annual Report Download - page 30
Download and view the complete annual report
Please find page 30 of the 2014 Qantas annual report below. You can navigate through the pages in the report by either clicking on the pages listed below, or by using the keyword search tool below to find specific information within the annual report.-
 1
1 -
2
-
3
-
4
-
5
-
6
-
7
-
8
-
9
-
10
-
11
-
12
-
13
-
14
-
15
-
16
-
17
-
18
-
19
-
 20
20 -
 21
21 -
 22
22 -
 23
23 -
 24
24 -
 25
25 -
 26
26 -
 27
27 -
 28
28 -
 29
29 -
 30
30 -
 31
31 -
 32
32 -
 33
33 -
 34
34 -
 35
35 -
 36
36 -
 37
37 -
 38
38 -
 39
39 -
 40
40 -
41
-
42
-
43
-
44
-
45
-
46
-
47
-
48
-
49
-
50
-
51
-
52
-
53
-
54
-
55
-
56
-
57
-
58
-
59
-
60
-
61
-
62
-
63
-
64
-
65
-
66
-
67
-
68
-
69
-
70
-
71
-
72
-
73
-
74
-
75
-
76
-
77
-
78
-
79
-
80
-
81
-
82
-
83
-
84
-
85
-
86
-
87
-
88
-
89
-
90
-
91
-
92
-
93
-
94
-
95
-
96
-
97
-
98
-
99
-
100
-
101
-
102
-
103
-
104
-
105
-
106
-
107
-
108
-
109
-
110
-
111
-
112
-
113
-
114
-
115
-
116
-
117
-
118
-
119
-
120
-
121
-
122
-
123
-
124
-
125
-
126
-
127
-
128
-
129
-
130
-
131
-
132
 |
 |
28
QANTAS ANNUAL REPORT 2014
REVIEW OF OPERATIONS CONTINUED
FOR THE YEAR ENDED 30 JUNE 2014
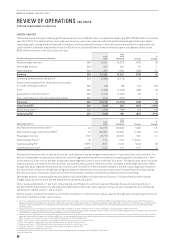
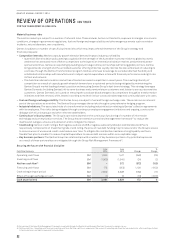
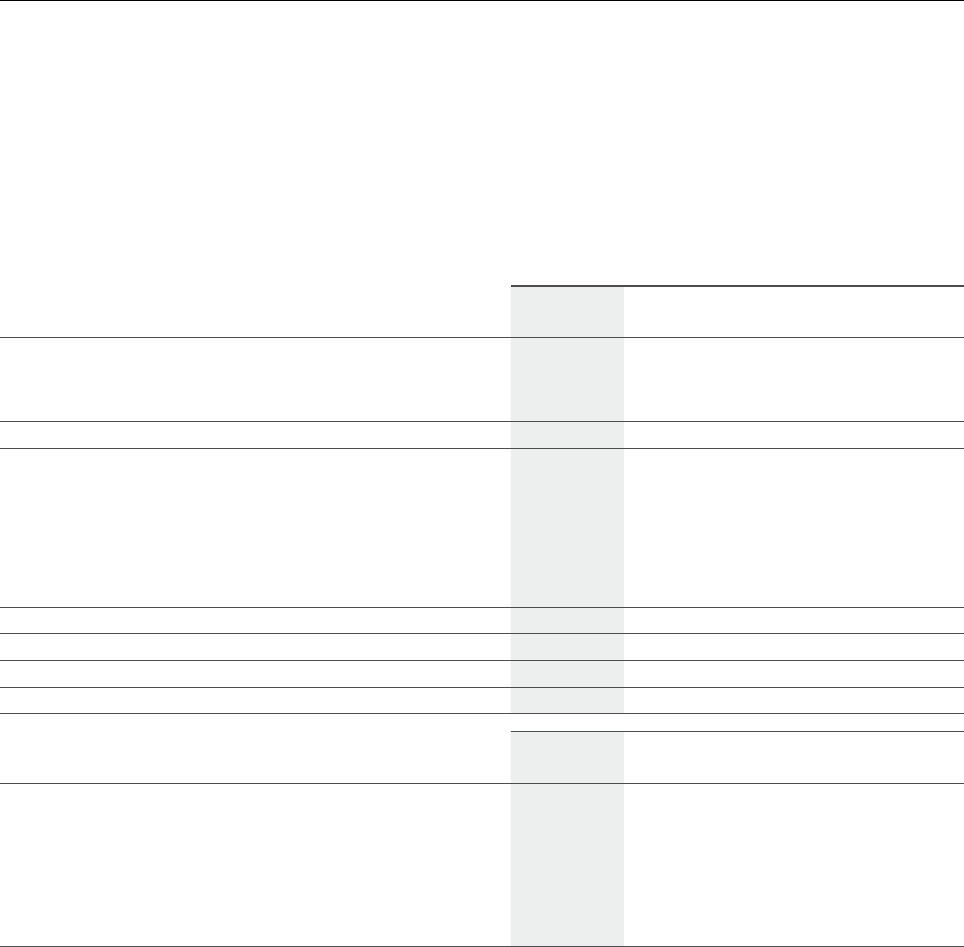
UNDERLYING PBT
The Qantas Group full-year Underlying PBT decreased to a loss of $646million, compared to Underlying PBT of $186million in financial
year 2012/2013. The deterioration in earnings was driven by a decline in revenue, with both yield and passenger loads lower due to
capacity growth running ahead of demand in domestic and international markets. A three per cent improvement in comparable unit
cost6 related to benefits being realised from the $2 billion2 accelerated Qantas Transformation program, though was offset by the
$253million increase in fuel cost to the prior year.
Group Underlying Income Statement Summary
June
2014
June
2013
Restated7Change
%
Change
Net passenger revenue8 $M 13,242 13,673 (431) (3)
Net freight revenue $M 955 935 20 2
Other revenue8$M 1,155 1,294 (139) (11)
Revenue $M 15,352 15,902 (550) (3)
Operating expenses (excluding fuel)9 $M (9,288) (9,279) (9) –
Share of net (loss)/profit of investments accounted
for under the equity method $M (66) (39) (27) (69)
Fuel9$M (4,496) (4,243) (253) (6)
Depreciation and amortisation $M (1,422) (1,450) 28 2
Non-cancellable aircraft operating lease rentals $M (520) (525) 5 1
Expenses $M (15,792) (15,536) (256) (2)
Underlying EBIT $M (440) 366 (806) >(100)
Net finance costs9$M (206) (180) (26) (14)
Underlying PBT $M (646) 186 (832) >(100)
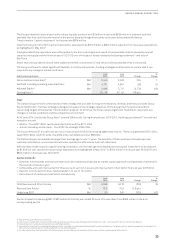
Operating Statistics
June
2014
June
2013
Restated7Change
%
Change
Available Seat Kilometres (ASK)10 M141,715 139,909 1,806 1.3
Revenue Passenger Kilometres (RPK)11 M109,659 110,905 (1,246) (1.1)
Passengers Carried ‘000 48,776 48,276 500 1.0
Revenue Seat Factor12 %7 7.4 79.3 (1.9) pts
Yield (excluding FX)13 c/RPK 10.02 10.29 (0.27) (3)
Comparable unit cost6c/ASK 5.00 5.15 0.15 3
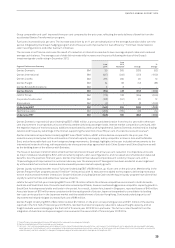
Revenue fell three per cent, driven by a three per cent decline in net passenger revenue and an 11 per cent fall in other revenue. The
decline in passenger revenue was primarily the result of aggressive international competitor capacity growth into Australia14, with
an increase of 9.5 per cent in the year and growth above eight per cent for each of the last four years. Foreign airlines have continued
to grow capacity into Australia in recent years, attracted by the country’s relative economic strength and the high Australian dollar,
though that pace of growth has slowed into financial year 2014/2015. In the Australian domestic market, capacity growth slowed in
the second half of the year, though has still grown ahead of demand for a second consecutive year. Demand has been impacted by
the resource sector slowdown, cautious business environment, and most recently by subdued consumer spending.
Net freight revenue increased with the acquisition and consolidation of Australian air Express. This was offset by lower Qantas
Freight capacity as a result of Qantas International network reductions.
Other revenue declined by 11 per cent, reflecting reduced third party contract revenue following the sale of catering centres in
the 2012/2013 financial year and the sale of Qantas Defence Services. Other revenue in the prior year included the one-off Boeing
settlement15 of $125million in the first half.
Qantas Loyalty reached the milestone of 10million members16, and continued to grow revenue through new and existing commercial
partners to achieve another record result.
6 Unit cost is adjusted to aid comparability between reporting periods. Comparable unit cost is calculated as Underlying PBT less passenger revenue and fuel, adjusted for the impact of
Boeing settlement and change in estimate of passenger revenue received in advance (2012/2013), changes in foreign exchange rates. Share of net loss of investments accounted for under
the equity method and movements in average sector length per ASK. Comparable unit cost is the primary measure of unit cost used by the Qantas Group to aid comparability between
reporting periods.
7 The 2012/2013 Group Underlying Income Statement has been restated as a result of the application of new or revised accounting standards. Refer to Note 38.
8 Net passenger revenue has been adjusted in 2013/2014 to include charter revenue previously reported as Other revenue. 2012/2013 Net passenger revenue and Other revenue has been
reclassified accordingly. These items remain excluded from the calculation of yield.
9 Underlying operating expenses (excluding fuel and Share of net loss of investments accounted for under the equity method), fuel and net finance costs differ from equivalent statutory
expenses due to items excluded from Underlying PBT, such as adjustments for impacts of AASB 139 which relate to other reporting periods and other items identified by Management.
Refer to page 36 for a reconciliation of Underlying PBT to Statutory (Loss)/Profit Before Tax.
10 ASK – total number of seats available for passengers, multiplied by the number of kilometres flown.
11 RPK – total number of passengers carried, multiplied by the number of kilometres flown.
12 Revenue Seat Factor – RPKs divided by ASKs. Also known as seat factor, load factor or load.
13 Yield (excluding FX) – Passenger revenue excluding foreign exchange, divided by RPKs.
14 BITRE data, Qantas modelled for June 2014.
15 Boeing settlement of $125 million in first half of 2012/2013 following the restructuring of the Group’s B787-8 deliveries.
16 As of 2 June 2014.