Qantas 2014 Annual Report Download - page 8
Download and view the complete annual report
Please find page 8 of the 2014 Qantas annual report below. You can navigate through the pages in the report by either clicking on the pages listed below, or by using the keyword search tool below to find specific information within the annual report.-
 1
1 -
 2
2 -
 3
3 -
 4
4 -
 5
5 -
 6
6 -
 7
7 -
 8
8 -
 9
9 -
 10
10 -
 11
11 -
 12
12 -
 13
13 -
 14
14 -
 15
15 -
 16
16 -
 17
17 -
 18
18 -
 19
19 -
20
-
21
-
22
-
23
-
24
-
25
-
26
-
27
-
28
-
29
-
30
-
31
-
32
-
33
-
34
-
35
-
36
-
37
-
38
-
39
-
40
-
41
-
42
-
43
-
44
-
45
-
46
-
47
-
48
-
49
-
50
-
51
-
52
-
53
-
54
-
55
-
56
-
57
-
58
-
59
-
60
-
61
-
62
-
63
-
64
-
65
-
66
-
67
-
68
-
69
-
70
-
71
-
72
-
73
-
74
-
75
-
76
-
77
-
78
-
79
-
80
-
81
-
82
-
83
-
84
-
85
-
86
-
87
-
88
-
89
-
90
-
91
-
92
-
93
-
94
-
95
-
96
-
97
-
98
-
99
-
100
-
101
-
102
-
103
-
104
-
105
-
106
-
107
-
108
-
109
-
110
-
111
-
112
-
113
-
114
-
115
-
116
-
117
-
118
-
119
-
120
-
121
-
122
-
123
-
124
-
125
-
126
-
127
-
128
-
129
-
130
-
131
-
132
 |
 |

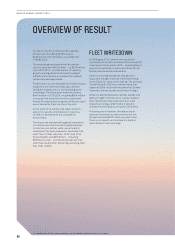
OVERVIEW OF RESULT1
For the 12 months to 30 June 2014, Qantas
announced an Underlying PBT loss of
$646 million and a Statutory Loss After Tax
of $2.8 billion.
The underlying result was driven by market
record fuel costs of $4.5 billion – up $253 million1
from 2012/2013 – and the impact of capacity
growth running ahead of demand, leading to
a $550 million decline in revenue from weaker
yields and passenger loads.
The $2 billion accelerated Qantas Transformation
program is permanently reducing costs and
laying the foundations for sustainable growth
in earnings. Transformation benefits totalled
$440 million in 2013/2014, including $204 million
in second-half benefits from the accelerated
Qantas Transformation program, while unit costs
were reduced by 3 per cent over the year.
At the same time, Qantas has taken action to
adjust its capacity and network in response
to shifts in demand and the competitive
environment.
The Group has maintained targeted investment
in customer service to sustain yield premiums
for Qantas and Jetstar, while overall capital
investment has been reduced to maximise free
cash flow for debt reduction. At 30 June 2014,
Group liquidity was $3.6 billion – including
$3 billion in cash – and the Group was net free
cash flow neutral after delivering operating cash
flow of $1.1 billion.
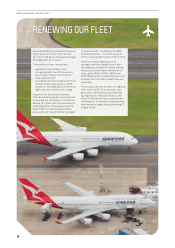
FLEET WRITEDOWN
On 28 August 2014, Qantas announced the
outcomes of a structural review of the Group that
commenced in December 2013 – including Board
approval to establish a new corporate entity for
the Qantas International business.
Under accounting standards, this decision
required a change in Qantas’ Cash Generating
Units (CGUs) for impairment testing. The previous
‘Qantas Brands’ CGU has now been split into
separate CGUs for Qantas International, Qantas
Domestic, Qantas Loyalty and Qantas Freight.
While the Qantas Domestic, Qantas Loyalty and
Qantas Freight CGUs are all in surplus, Qantas
Internationanal’s CGU required a non-cash
impairment charge of $2.6 billion, which is
included in the statutory result for 2013/2014.
Following this writedown, the depreciation
expense of Qantas International aircraft will
be approximately $200 million per year lower.
There is no impact on the Group’s or Qantas
International’s cash earnings.
1 For explanations of non-statutory measures, see the Review of Operations section in this report.
06
QANTAS ANNUAL REPORT 2014