Qantas 2014 Annual Report Download - page 20
Download and view the complete annual report
Please find page 20 of the 2014 Qantas annual report below. You can navigate through the pages in the report by either clicking on the pages listed below, or by using the keyword search tool below to find specific information within the annual report.-
 1
1 -
2
-
3
-
4
-
5
-
6
-
7
-
8
-
9
-
 10
10 -
 11
11 -
 12
12 -
 13
13 -
 14
14 -
 15
15 -
 16
16 -
 17
17 -
 18
18 -
 19
19 -
 20
20 -
 21
21 -
 22
22 -
 23
23 -
 24
24 -
 25
25 -
 26
26 -
 27
27 -
 28
28 -
 29
29 -
 30
30 -
31
-
32
-
33
-
34
-
35
-
36
-
37
-
38
-
39
-
40
-
41
-
42
-
43
-
44
-
45
-
46
-
47
-
48
-
49
-
50
-
51
-
52
-
53
-
54
-
55
-
56
-
57
-
58
-
59
-
60
-
61
-
62
-
63
-
64
-
65
-
66
-
67
-
68
-
69
-
70
-
71
-
72
-
73
-
74
-
75
-
76
-
77
-
78
-
79
-
80
-
81
-
82
-
83
-
84
-
85
-
86
-
87
-
88
-
89
-
90
-
91
-
92
-
93
-
94
-
95
-
96
-
97
-
98
-
99
-
100
-
101
-
102
-
103
-
104
-
105
-
106
-
107
-
108
-
109
-
110
-
111
-
112
-
113
-
114
-
115
-
116
-
117
-
118
-
119
-
120
-
121
-
122
-
123
-
124
-
125
-
126
-
127
-
128
-
129
-
130
-
131
-
132
 |
 |

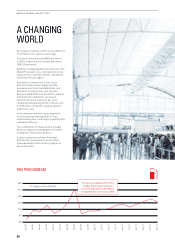
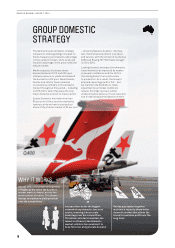
The Qantas Group’s domestic strategy
is based on simple guiding principles: to
hold a frequency and network advantage
in the premium market, and a scale and
network advantage in the price-sensitive
leisure market.
Market capacity increases above
demand between 2012 and 2014 put
intense pressure on yields and reduced
the domestic profit pool. Nevertheless,
Qantas and Jetstar have remained
consistently profitable in the domestic
market throughout this period – including
in 2013/2014, when they were the only
major domestic carriers to make a profit.
Qantas Domestic has held more than
80 per cent of the corporate market by
revenue, while we have increased our
share of the charter market to 30 per cent
– driven by Network Aviation. We have
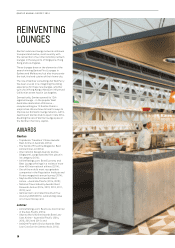
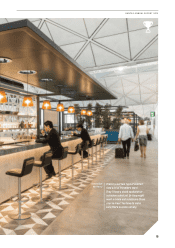
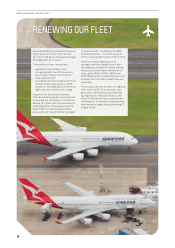
also maintained investment in product
and service, with the refresh of our Airbus
A330 and Boeing 737-800 fleets to begin
in 2014/2015.
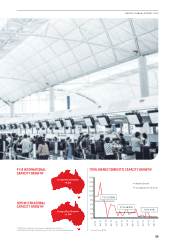
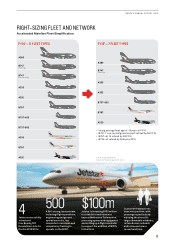
Looking forward, we expect the domestic
travel market to be impacted by weaker
consumer confidence and the shift in
the mining boom from construction
to production. As a result, the Group’s
planned capacity growth is flat – but
we maintain the flexibility to make
adjustments as market conditions
require. Earnings recovery will be
underpinned by delivery of cost reduction
and a stabilising operating environment.
Qantas offers the greatest frequency
of flights at the times the business
market wants to travel, across the
most number of routes. This allows
Qantas to maintain a yield premium
over the competition.
WHY IT WORKS
Jetstar offers by far the biggest
network of any domestic low-cost
carrier, meaning it has a scale
advantage over the competition.
This allows Jetstar to maintain the
lowest cost base in the domestic
market, which in turn enables it to
keep fares low and generate demand.
Qantas and Jetstar together
maintain a capacity share in the
domestic market that allows the
Group to maximise profit over the
long term.
GROUP DOMESTIC
STRATEGY
18
QANTAS ANNUAL REPORT 2014