Qantas 2014 Annual Report Download - page 60
Download and view the complete annual report
Please find page 60 of the 2014 Qantas annual report below. You can navigate through the pages in the report by either clicking on the pages listed below, or by using the keyword search tool below to find specific information within the annual report.-
 1
1 -
2
-
3
-
4
-
5
-
6
-
7
-
8
-
9
-
10
-
11
-
12
-
13
-
14
-
15
-
16
-
17
-
18
-
19
-
20
-
21
-
22
-
23
-
24
-
25
-
26
-
27
-
28
-
29
-
30
-
31
-
32
-
33
-
34
-
35
-
36
-
37
-
38
-
39
-
40
-
41
-
42
-
43
-
44
-
45
-
46
-
47
-
48
-
49
-
 50
50 -
 51
51 -
 52
52 -
 53
53 -
 54
54 -
 55
55 -
 56
56 -
 57
57 -
 58
58 -
 59
59 -
 60
60 -
 61
61 -
 62
62 -
 63
63 -
 64
64 -
 65
65 -
 66
66 -
 67
67 -
 68
68 -
 69
69 -
 70
70 -
71
-
72
-
73
-
74
-
75
-
76
-
77
-
78
-
79
-
80
-
81
-
82
-
83
-
84
-
85
-
86
-
87
-
88
-
89
-
90
-
91
-
92
-
93
-
94
-
95
-
96
-
97
-
98
-
99
-
100
-
101
-
102
-
103
-
104
-
105
-
106
-
107
-
108
-
109
-
110
-
111
-
112
-
113
-
114
-
115
-
116
-
117
-
118
-
119
-
120
-
121
-
122
-
123
-
124
-
125
-
126
-
127
-
128
-
129
-
130
-
131
-
132
 |
 |

58
QANTAS ANNUAL REPORT 2014
DIRECTORS’ REPORT CONTINUED
FOR THE YEAR ENDED 30 JUNE 2014
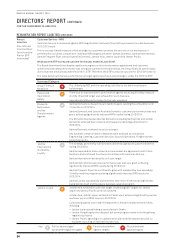
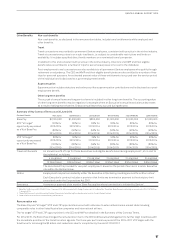
This change in pay mix involves a decrease in the STIP opportunity and an increase in the LTIP opportunity for each Executive. The
pay mix changes that apply to the CEO and KMP for 2014/2015 are also detailed in the Summary of Key Contract Terms on page 57.
There is no increase to the total “at target” remuneration as a result of these changes as the increase in LTIP opportunity is offset by
adecrease in STIP opportunity.
At Qantas, the “at target” STIP and LTIP awards are normally expressed as a percentage of Base Pay, however, for the purpose of the
following remuneration mix tables, Base Pay, STIP and LTIP opportunities are expressed as a percentage of total pay.
The target remuneration mix does not match the actual remuneration mix for 2013/2014, as:
–No awards were made under the 2013/14 STIP
–Actual reward mix is calculated on an accrual basis in accordance with accounting standards, so each year’s remuneration
includes a portion of the value of share-based payments awarded in previous years.
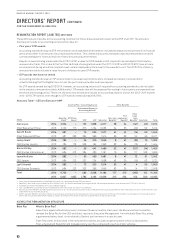
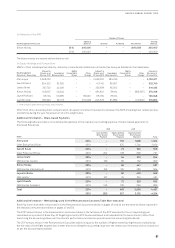
Target Remuneration Mix for 2013/2014
Base Pay
%
STIP
%
LTIP
%
Alan Joyce 33 40 27
Gareth Evans 43 35 22
Lesley Grant 49 39 12
Simon Hickey 43 35 22
Jayne Hrdlicka 43 35 22
Lyell Strambi 43 35 22
Performance Related Remuneration
STIP
LTIP
Cash-based Share-based
Statutory Remuneration Mix
Base Pay & Other
%
Cash Incentives
%
Cash-settled
%
Equity-settled
%
Rights Awards
%
Alan Joyce 50 00446
Gareth Evans 64 0 0 5 31
Lesley Grant 75 00520
Simon Hickey 65 0 0 5 30
Jayne Hrdlicka 68 0 0 4 28
Lyell Strambi 65 0 0 4 31
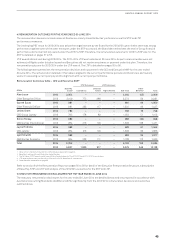
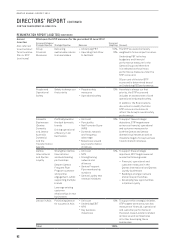
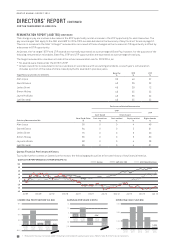
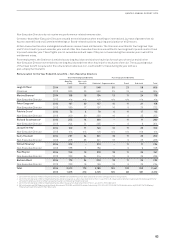
Qantas Financial Performance History
To provide further context on Qantas’ performance, the following graphs outline a five-year history of key financial metrics.
REMUNERATION REPORT (AUDITED) CONTINUED
QANTAS TSR PERFORMANCE VS PEER GROUPS (%)
UNDERLYING PROFIT BEFORE TAX ($M)
1 Restated for the impact of revised AASB 119 relating to refined benefit superannuation plans. Refer to Note 38 of the Financial Statements
Jul 09 Dec 09 Jul 10 Dec 10 Jun 11 Dec 11 Jun 12 Dec 12 Jun 13 Dec 13 Jun 14
Qantas S&P/ASX 100 MSCI World Airlines
-60
-20
-40
20
0
40
60
80
100
0
200
400
600
800
(800)
377 552 95 1861(646)
2009/
2010
2010/
2011
2011/
2012
2012/
2013
2013/
2014
OPERATING CASH FLOW ($M)
1,000
1,600
1,300
1,900
1,351 1,782 1,810 1,417 1,069
2009/
2010
2010/
2011
2011/
2012
2012/
2013
2013/
2014
EARNINGS PER SHARE (CENTS)
(15)
(5)
0
5
10
15
2009/
2010
2010/
2011
2011/
2012
2012/
2013
2013/
2014
4.9 11.0
(10.8) (128.5)
0.0418