Qantas 2014 Annual Report Download - page 63
Download and view the complete annual report
Please find page 63 of the 2014 Qantas annual report below. You can navigate through the pages in the report by either clicking on the pages listed below, or by using the keyword search tool below to find specific information within the annual report.-
 1
1 -
2
-
3
-
4
-
5
-
6
-
7
-
8
-
9
-
10
-
11
-
12
-
13
-
14
-
15
-
16
-
17
-
18
-
19
-
20
-
21
-
22
-
23
-
24
-
25
-
26
-
27
-
28
-
29
-
30
-
31
-
32
-
33
-
34
-
35
-
36
-
37
-
38
-
39
-
40
-
41
-
42
-
43
-
44
-
45
-
46
-
47
-
48
-
49
-
50
-
51
-
52
-
 53
53 -
 54
54 -
 55
55 -
 56
56 -
 57
57 -
 58
58 -
 59
59 -
 60
60 -
 61
61 -
 62
62 -
 63
63 -
 64
64 -
 65
65 -
 66
66 -
 67
67 -
 68
68 -
 69
69 -
 70
70 -
 71
71 -
 72
72 -
 73
73 -
74
-
75
-
76
-
77
-
78
-
79
-
80
-
81
-
82
-
83
-
84
-
85
-
86
-
87
-
88
-
89
-
90
-
91
-
92
-
93
-
94
-
95
-
96
-
97
-
98
-
99
-
100
-
101
-
102
-
103
-
104
-
105
-
106
-
107
-
108
-
109
-
110
-
111
-
112
-
113
-
114
-
115
-
116
-
117
-
118
-
119
-
120
-
121
-
122
-
123
-
124
-
125
-
126
-
127
-
128
-
129
-
130
-
131
-
132
 |
 |

61
QANTAS ANNUAL REPORT 2014
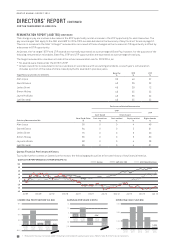
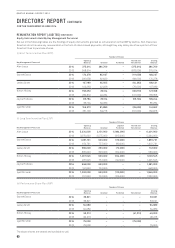
(iv) Retention Plan (RP)
Number of Shares
Key Management Personnel
Opening
Balance Granted Forfeited Transferred
Closing
Balance
Simon Hickey 2014 400,000 – – (200,000) 200,000
2013 400,000 –––400,000
The above shares are vested and available to call.
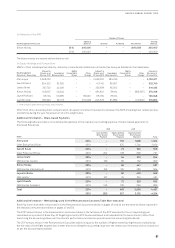
(v) Equity Holdings and Transactions
KMPs or their related parties directly, indirectly or beneficially held shares in the Qantas Group as detailed in the table below:
Key Management
Personnel – Executives
Interest in
Shares as at
30 June 2012
Awarded as
Remuneration
Rights
Converted to
Shares
Other
Change1
Interest in
Shares as at
30 June 2013
Awarded as
Remuneration
Rights
Converted to
Shares
Other
Change1
Interest in
Shares as at
30 June 2014
Alan Joyce 2,906,202 –––2,906,202 284,769 – – 3,19 0,971
Gareth Evans 354,522 62,620 – – 417,142 85,607 – – 502,749
Lesley Grant 207,752 42,926 – – 250,678 65,505 – – 316,183
Simon Hickey 912,607 49,234 – – 961,841 78,164 –(663,607) 376,398
Jayne Hrdlicka 35,704 50,080 –33,000 118,784 78,164 – – 196,948
Lyell Strambi 337,3 0 0 59,773 –(151,500) 245,573 81,889 –(110,6 00) 216,862
1 Other change includes shares purchased, sold or forfeited.
Other than share-based payment compensation, all equity instrument transactions between the KMP, including their related parties,
and Qantas during the year have been on an arm’s length basis.
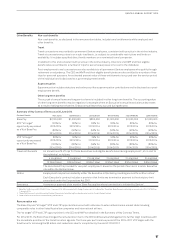
Additional Information – Share-based Payments
The following table provides a more detailed breakdown of the statutory accounting expense of share-based payments to
disclosed
Executives.
$’000
STIP LTIP
Cash Settled
Share-based
Payment
Equity Settled
Share-based
Payment
Equity Settled
Share-based
Payment Total
Alan Joyce 2014 –155 1,808 1,963
Chief Executive Officer 2013 –375 1,794 2,169
Gareth Evans 2014 –76 520 596
Chief Financial Officer 2013 202 133 366 701
Lesley Grant 2014 –54 210 264
CEO Qantas Loyalty 2013 139 89 162 390
Simon Hickey 2014 –66 441 507
CEO Qantas International 2013 159 125 280 564
Jayne Hrdlicka 2014 –60 439 499
CEO Jetstar 2013 162 75 224 461
Lyell Strambi 2014 –72 520 592
CEO Qantas Domestic 2013 193 130 366 689
Total 2014 –483 3,938 4,421
2013 855 927 3,192 4,974
Additional Information – Methodology used for the Remuneration Outcomes Table (Non-statutory)
Base Pay (cash) and other remuneration in the Remuneration Outcomes tables on pages 46 and 49 are the same as those reported in
the statutory remuneration tables on pages 47 and 50.
The STIP amount shown in the Remuneration Outcomes tables is the full value of the STIP awarded for the corresponding year
calculated as a product of Base Pay, At Target Opportunity, STIP Scorecard Result and Individual Performance Factor (rather than
amortising the accounting value over the relevant performance and service period as per the accounting standards).
The LTIP amount shown in the Remuneration Outcomes tables is equal to the number of Rights vested during the year multiplied by
the fair value of the Right at grant date (rather than amortising the accounting value over the relevant performance and service period
as per the accounting standards).