Proctor and Gamble 2010 Annual Report Download - page 69
Download and view the complete annual report
Please find page 69 of the 2010 Proctor and Gamble annual report below. You can navigate through the pages in the report by either clicking on the pages listed below, or by using the keyword search tool below to find specific information within the annual report.-
 1
1 -
2
-
3
-
4
-
5
-
6
-
7
-
8
-
9
-
10
-
11
-
12
-
13
-
14
-
15
-
16
-
17
-
18
-
19
-
20
-
21
-
22
-
23
-
24
-
25
-
26
-
27
-
28
-
29
-
30
-
31
-
32
-
33
-
34
-
35
-
36
-
37
-
38
-
39
-
40
-
41
-
42
-
43
-
44
-
45
-
46
-
47
-
48
-
49
-
50
-
51
-
52
-
53
-
54
-
55
-
56
-
57
-
58
-
 59
59 -
 60
60 -
 61
61 -
 62
62 -
 63
63 -
 64
64 -
 65
65 -
 66
66 -
 67
67 -
 68
68 -
 69
69 -
 70
70 -
 71
71 -
 72
72 -
 73
73 -
 74
74 -
 75
75 -
 76
76 -
 77
77 -
 78
78 -
 79
79 -
80
-
81
-
82
 |
 |

Notes to Consolidated Financial Statements The Procter & Gamble Company 67
Amounts in millions of dollars except per share amounts or as otherwise specified.
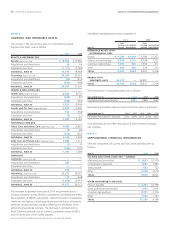
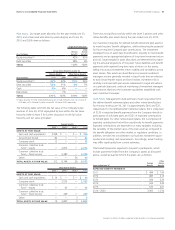
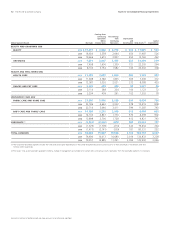
Plan Assets. Our target asset allocation for the year ended June30,
2010, and actual asset allocation by asset category as of June30,
2010 and 2009, were as follows:
Target Asset Allocation
Asset Category
Pension
Benefits
Other
Retiree
Benefits
Equity securities (1) 42% 91%
Debt securities 58% 9%
TOTAL 100% 100%
Actual Asset Allocation at June 30
Pension Benefits Other Retiree Benefits
Asset Category 2010 2009 2010 2009
Equity securities (1) 43% 42% 91% 93%
Debt securities 53% 51% 9% 7%
Cash 4% 6% ——
Real estate —1% ——
TOTAL 100% 100% 100% 100%
(1) Equity securities for other retiree benefit plan assets include Company stock, net of Series B
ESOP debt, of $2,535 and $2,084 as of June 30, 2010 and 2009, respectively.
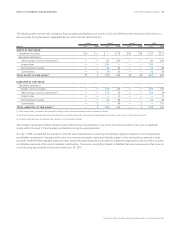
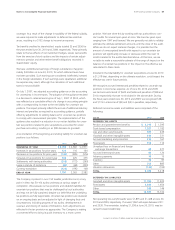
The following table sets forth the fair value of the Company’s plan
assets as of June30, 2010 segregated by level within the fair value
hierarchy (refer to Note 5 for further discussion on the fair value
hierarchy and fair value principles):
Pension Benefits
Level 1 Level 2 Level 3 Total
ASSETS AT FAIR VALUE:
Cash and cash equivalents $238 $ — $ — $ 238
Government bonds 62 — — 62
Company stock 12 — — 12
Common collective trust
fund — equity — 2,814 — 2,814
Common collective trust
fund — fixed income — 3,380 — 3,380
Other — — 56 56
TOTAL ASSETS AT FAIR VALUE 312 6,194 56 6,562
Other Retiree Benefits
Level 1 Level 2 Level 3 Total
ASSETS AT FAIR VALUE:
Cash and cash equivalents $ 14 $ — $ — $ 14
Company stock — 2,535 — 2,535
Common collective trust
fund — equity — 43 — 43
Common collective trust
fund — fixed income — 249 — 249
Other — — 2 2
TOTAL ASSETS AT FAIR VALUE 14 2,827 2 2,843
There was no significant activity within the Level 3 pension and other
retiree benefits plan assets during the year ended June30, 2010.
Our investment objective for defined benefit retirement plan assets is
to meet the plans’ benefit obligations, while minimizing the potential
for future required Company plan contributions. The investment
strategies focus on asset class diversification, liquidity to meet benefit
payments and an appropriate balance of long-term investment return
and risk. Target ranges for asset allocations are determined by match-
ing the actuarial projections of the plans’ future liabilities and benefit
payments with expected long-term rates of return on the assets,
taking into account investment return volatility and correlations across
asset classes. Plan assets are diversified across several investment
managers and are generally invested in liquid funds that are selected
to track broad market equity and bond indices. Investment risk is
carefully controlled with plan assets rebalanced to target allocations
on a periodic basis and continual monitoring of investment managers’
performance relative to the investment guidelines established with
each investment manager.
Cash Flows. Management’s best estimate of cash requirements for
the defined benefit retirement plans and other retiree benefit plans
for the year ending June30, 2011 is approximately $441 and $25,
respectively. For the defined benefit retirement plans, this is comprised
of $120 in expected benefit payments from the Company directly to
participants of unfunded plans and $321 of expected contributions
to funded plans. For other retiree benefit plans, this is comprised of
expected contributions that will be used directly for benefit payments.
Expected contributions are dependent on many variables, including
the variability of the market value of the plan assets as compared to
the benefit obligation and other market or regulatory conditions. In
addition, we take into consideration our business investment oppor-
tunities and resulting cash requirements. Accordingly, actual funding
may differ significantly from current estimates.
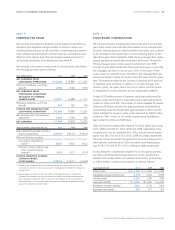
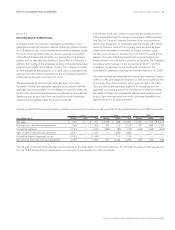
Total benefit payments expected to be paid to participants, which
include payments funded from the Company’s assets, as discussed
above, as well as payments from the plans, are as follows:
Years ending June 30
Pension
Benefits
Other
Retiree
Benefits
EXPECTED BENEFIT PAYMENTS
2011 $ 494 $ 195
2012 487 213
2013 500 230
2014 524 245
2015 537 261
2016 – 2020 3,063 1,530