Proctor and Gamble 2010 Annual Report Download - page 42
Download and view the complete annual report
Please find page 42 of the 2010 Proctor and Gamble annual report below. You can navigate through the pages in the report by either clicking on the pages listed below, or by using the keyword search tool below to find specific information within the annual report.-
 1
1 -
2
-
3
-
4
-
5
-
6
-
7
-
8
-
9
-
10
-
11
-
12
-
13
-
14
-
15
-
16
-
17
-
18
-
19
-
20
-
21
-
22
-
23
-
24
-
25
-
26
-
27
-
28
-
29
-
30
-
31
-
 32
32 -
 33
33 -
 34
34 -
 35
35 -
 36
36 -
 37
37 -
 38
38 -
 39
39 -
 40
40 -
 41
41 -
 42
42 -
 43
43 -
 44
44 -
 45
45 -
 46
46 -
 47
47 -
 48
48 -
 49
49 -
 50
50 -
 51
51 -
 52
52 -
53
-
54
-
55
-
56
-
57
-
58
-
59
-
60
-
61
-
62
-
63
-
64
-
65
-
66
-
67
-
68
-
69
-
70
-
71
-
72
-
73
-
74
-
75
-
76
-
77
-
78
-
79
-
80
-
81
-
82
 |
 |

40 The Procter & Gamble Company Management’s Discussion and Analysis
The economic downturn which began in fiscal 2009 resulted in a
disproportionate decline in the Salon Professional business, given the
more discretionary nature of salon visits and purchases. Over time,
we believe the Salon Professional business will return to sales and
earnings growth rates consistent with our long-term business plans.
Failure to achieve these business plans or a further deterioration of
the macroeconomic conditions could result in an impairment of the
goodwill and intangible assets of the Salon Professional business.
See the discussion of Acquisitions, Goodwill and Intangibles in the
Significant Accounting Policies and Estimates section for additional
information.
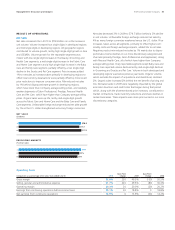
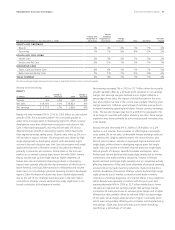
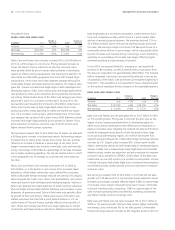
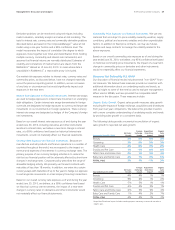
GROOMING
($millions) 2010
Change vs.
Prior Year 2009
Change vs.
Prior Year
Volume n/a +1% n/a -5%
Net sales $7,631 +3% $7,408 -9%
Net earnings $1,477 +9% $1,359 -14%
Grooming net sales increased 3% to $7.6billion in 2010 on a 1%
increase in unit volume. Price increases, taken primarily in developing
regions to offset currency devaluations and across blades and razors,
added 4% to net sales. Product mix had a negative 2% impact on net
sales due mainly to disproportionate growth in developing regions
and of disposable razors, both of which have lower than segment
average selling prices. Organic sales grew 3%. Volume in developing
regions increased low single digits, while volume in developed regions
was in line with the prior year. Volume in Male Grooming was up low
single digits mainly due to growth of disposable razors in developing
regions. Mach3 shipments declined high single digits, while Gillette
Fusion shipments increased double digits behind the launch of the new
Fusion ProGlide. On a constant currency basis, global market share
of the blades and razors category was down about half a point versus
the prior year. Volume in Appliances was down low single digits behind
a mid-single-digit decline in developing regions, due mostly to market
contractions and volume share losses in home and hair care appliances.
Global value share of the dry shaving market was up half a point on a
constant currency basis.
Net earnings increased 9% to $1.5billion in 2010 behind sales growth
and net earnings margin expansion. Net earnings margin increased
100 basis points driven by gross margin expansion and a lower tax
rate, partially offset by higher SG&A as a percentage of net sales. Gross
margin increased mainly due to price increases and manufacturing
cost savings. The reduction in the tax rate was mainly due to a shift in
the geographic mix of earnings to developing regions which generally
have lower statutory tax rates. The increase in SG&A as a percentage
of net sales was driven by higher marketing spending and incremental
foreign currency exchange costs, partially offset by lower overhead
spending as a percentage of net sales.
Grooming net sales declined 9% in 2009 to $7.4billion on a 5%
decline in unit volume. Unfavorable foreign exchange reduced net
sales by 6%. Product mix had a negative 2% impact on net sales as
favorable product mix from growth of the premium-priced Gillette
Fusion brand was more than offset by a disproportionate decline of
Appliances, both of which have higher than segment average selling
prices. Price increases, taken across most product lines and in part to
offset foreign exchange impacts in developing regions, added 4% to
net sales. Organic sales were down 2% versus the prior year on a 5%
decline in organic volume, mainly due to the sharp decline of the
Appliances business. Volume in both developed and developing regions
declined mid-single digits. Male Grooming volume declined low
single digits primarily driven by market contractions in developed
regions and trade inventory reductions. Growth of Gillette Fusion was
more than offset by declines in legacy shaving systems. Global value
share of male blades and razors was up less than half a point versus
the prior year. Volume in Appliances was down double digits due to
market contractions, trade inventory reductions and the exits of the
U.S. home appliance and Tassimo coffee appliance businesses. Global
value share of the male dry shaving market was down less than half a
point. Net earnings were down 14% in 2009 to $1.4billion primarily
on the decline in net sales and a 120-basis point reduction in net
earnings margin. Net earnings margin was down due to a higher
effective tax rate and reduced gross margin, partially offset by lower
SG&A as a percentage of net sales. Gross margin declined due to
unfavorable product mix resulting from disproportionate growth of
disposable razors, higher commodity costs and volume scale delever-
age which were partially offset by price increases and manufacturing
cost savings.
The economic downturn in fiscal 2009 resulted in a disproportionate
decline in the Appliances business, particularly in developing geogra-
phies, given the more discretionary nature of home and personal
grooming appliance purchases. Over time, we believe the Appliances
business will return to sales and earnings growth rates consistent with
our long-term business plans. Failure to achieve these business plans
or a further deterioration of the macroeconomic conditions could
result in an impairment of the goodwill and intangible assets of the
Appliance business. See the discussion of Acquisitions, Goodwill and
Intangibles in the Significant Accounting Policies and Estimates section
for additional information.
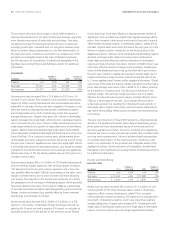
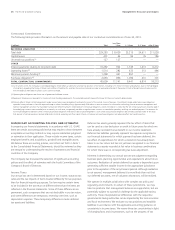
Health and Well-Being
HEALTH CARE
($millions) 2010
Change vs.
Prior Year 2009
Change vs.
Prior Year
Volume n/a +3% n/a -3%
Net sales $11,493 +2% $11,288 -7%
Net earnings $ 1,860 +1% $ 1,835 -9%
Health Care net sales increased 2% in 2010 to $11.5billion on unit
volume growth of 3%. Price increases, taken mainly in developing
regions to offset currency devaluations, added 1% to net sales.
Unfavorable mix reduced net sales by 2% mainly due to disproportion-
ate growth of developing regions, which have lower than segment
average selling prices. Organic sales increased 2%. Volume grew mid-
single digits in developing regions and low single digits in developed
regions. Oral Care volume grew mid-single digits behind initiative