Proctor and Gamble 2010 Annual Report Download - page 45
Download and view the complete annual report
Please find page 45 of the 2010 Proctor and Gamble annual report below. You can navigate through the pages in the report by either clicking on the pages listed below, or by using the keyword search tool below to find specific information within the annual report.-
 1
1 -
2
-
3
-
4
-
5
-
6
-
7
-
8
-
9
-
10
-
11
-
12
-
13
-
14
-
15
-
16
-
17
-
18
-
19
-
20
-
21
-
22
-
23
-
24
-
25
-
26
-
27
-
28
-
29
-
30
-
31
-
32
-
33
-
34
-
 35
35 -
 36
36 -
 37
37 -
 38
38 -
 39
39 -
 40
40 -
 41
41 -
 42
42 -
 43
43 -
 44
44 -
 45
45 -
 46
46 -
 47
47 -
 48
48 -
 49
49 -
 50
50 -
 51
51 -
 52
52 -
 53
53 -
 54
54 -
 55
55 -
56
-
57
-
58
-
59
-
60
-
61
-
62
-
63
-
64
-
65
-
66
-
67
-
68
-
69
-
70
-
71
-
72
-
73
-
74
-
75
-
76
-
77
-
78
-
79
-
80
-
81
-
82
 |
 |
Management’s Discussion and Analysis The Procter & Gamble Company 43
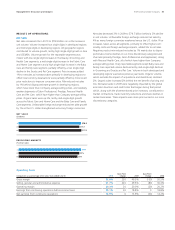
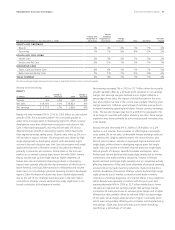
higher shipments of mid-tier brands, which have lower than segment
average selling prices, reduced net sales by 1%. Organic sales were
up 7% on a 2% increase in organic volume. Volume growth was
driven by low single-digit growth in developing regions, while volume
in developed regions was in line with the prior year. Baby Care volume
increased low single digits due to growth of Pampers primarily in
developing regions and double-digit growth of Luvs in North America.
Our global market share of baby care was up nearly half a point.
Family Care volume was down low single digits due to the Western
European family care divestiture. Organic volume for Family Care was
up low single digits behind double-digit growth of Charmin Basic and
Bounty Basic. U.S. market share on Bounty was up nearly 1 point,
while Charmin market share remained consistent with the prior year.
Net earnings were up 2% versus the prior year to $1.8billion due to
net sales growth and higher net earnings margin. Net earnings margin
increased 10 basis points as higher gross margin was partially offset
by an increase in SG&A as a percentage of net sales and a higher
effective tax rate. Gross margin improved due to the impact of price
increases, manufacturing cost savings and more positive product mix
following the Western European family care divestiture, which more
than offset higher commodity and energy costs. SG&A as a percent-
age of net sales increased due to the higher current period overhead
spending and base period reimbursements for services related to
the Western European family care divestiture, partially offset by lower
marketing spending.
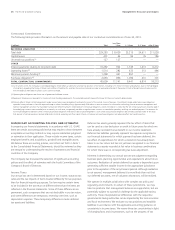
Corporate
Corporate includes certain operating and non-operating activities not
allocated to specific business units. These include: the incidental
businesses managed at the corporate level; financing and investing
activities; other general corporate items; the historical results of
certain divested brands and categories; and certain restructuring-type
activities to maintain a competitive cost structure, including manufac-
turing and workforce optimization. Corporate also includes reconciling
items to adjust the accounting policies used in the segments to U.S.
GAAP. The most significant reconciling items include income taxes
(to adjust from statutory rates that are reflected in the segments to
the overall Company effective tax rate), adjustments for unconsoli-
dated entities (to eliminate net sales, cost of products sold and SG&A
for entities that are consolidated in the segments but accounted for
using the equity method for U.S. GAAP) and noncontrolling interest
adjustments for subsidiaries where we do not have 100% ownership.
Since certain unconsolidated entities and less than 100%-owned
subsidiaries are managed as integral parts of the Company, they are
accounted for similar to a wholly-owned subsidiary for management
and segment purposes. This means our segment results recognize
100% of each income statement component through before-tax
earnings in the segments, with eliminations for unconsolidated
entities and noncontrolling interests in Corporate. In determining
segment after-tax net earnings, we apply the statutory tax rates (with
adjustments to arrive at the Company’s effective tax rate in Corporate)
and eliminate the share of earnings applicable to other ownership
interests, in a manner similar to noncontrolling interest.
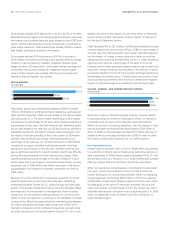
Corporate net sales primarily reflect the adjustment to eliminate the
sales of unconsolidated entities included in business segment results.
Accordingly, Corporate net sales is generally a negative balance. In
2010, negative net sales in Corporate were up 2% mainly due to
changes in reconciling items needed to adjust the accounting policies
used in the segments to U.S. GAAP. Net expenses from continuing
operations increased $603million to $817million. The increase was
primarily due to current period charges for potential competition law
fines and for recently enacted legislation impacting the taxation of
certain future retiree prescription drug subsidy payments and the impact
of higher prior-period divestiture gains and tax audit settlements.
These impacts were partially offset by lower current-period interest
expense and restructuring charges. Additional discussion of the items
impacting net expenses in Corporate can be found in the Results of
Operations section.
In 2009, negative net sales in Corporate declined $86million primarily
driven by lower adjustments to eliminate the sales of unconsolidated
entities included in business segment results. These adjustments
decreased due to lower net sales of existing unconsolidated entities.
Net expenses from continuing operations decreased $325million to
$214million. The decrease was primarily due to corporate hedging
impacts, lower interest expense and higher current period divestiture
gains, partially offset by higher restructuring spending.
FINANCIAL CONDITION
We believe our financial condition continues to be of high quality, as
evidenced by our ability to generate substantial cash from operations
and ready access to capital markets at competitive rates.
Operating cash flow provides the primary source of funds to finance
operating needs and capital expenditures. Excess operating cash is used
first to fund shareholder dividends. Other discretionary uses include
share repurchases and tack-on acquisitions to complement our port-
folio of brands and geographies. As necessary, we may supplement
operating cash flow with debt to fund these activities. The overall
cash position of the Company reflects our strong business results and
a global cash management strategy that takes into account liquidity
management, economic factors and tax considerations.
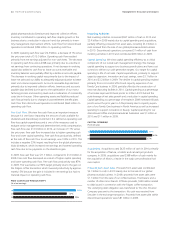
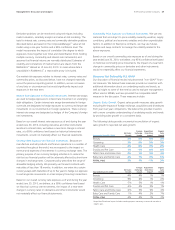
Operating Activities
Operating cash flow was $16.1billion in 2010, an 8% increase versus
the prior year. Operating cash flow resulted primarily from net earnings
adjusted for non-cash items (depreciation and amortization, stock-
based compensation, deferred income taxes and gain on the sale of
businesses) and a reduction in working capital. The increase in operating
cash flow was primarily due to the current year reduction in working
capital balances, partially offset by a decline in earnings versus 2009.
Working capital reductions contributed $2.5billion to operating cash
flow in 2010 mainly due to an increase in accounts payable, accrued
and other liabilities. Accounts payable, accrued and other liabilities
increased primarily due to increased expenditures to support business
growth, primarily related to the increased marketing investments.
Accounts receivable days were down year over year due mainly to the