Proctor and Gamble 2010 Annual Report Download - page 39
Download and view the complete annual report
Please find page 39 of the 2010 Proctor and Gamble annual report below. You can navigate through the pages in the report by either clicking on the pages listed below, or by using the keyword search tool below to find specific information within the annual report.-
 1
1 -
2
-
3
-
4
-
5
-
6
-
7
-
8
-
9
-
10
-
11
-
12
-
13
-
14
-
15
-
16
-
17
-
18
-
19
-
20
-
21
-
22
-
23
-
24
-
25
-
26
-
27
-
28
-
 29
29 -
 30
30 -
 31
31 -
 32
32 -
 33
33 -
 34
34 -
 35
35 -
 36
36 -
 37
37 -
 38
38 -
 39
39 -
 40
40 -
 41
41 -
 42
42 -
 43
43 -
 44
44 -
 45
45 -
 46
46 -
 47
47 -
 48
48 -
 49
49 -
50
-
51
-
52
-
53
-
54
-
55
-
56
-
57
-
58
-
59
-
60
-
61
-
62
-
63
-
64
-
65
-
66
-
67
-
68
-
69
-
70
-
71
-
72
-
73
-
74
-
75
-
76
-
77
-
78
-
79
-
80
-
81
-
82
 |
 |

Management’s Discussion and Analysis The Procter & Gamble Company 37
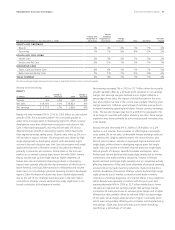
Income Taxes
The effective tax rate on continuing operations increased 140 basis
points to 27.3%. This was primarily due to a $152million charge for
recently enacted legislation which changed the taxation of certain
future retiree prescription drug subsidy payments in the United States,
the non-deductibility of the aforementioned $283million charge for
potential competition law fines and a lower current-year level of net
favorable adjustments to reserves for previously existing uncertain tax
positions and foreign tax credits, partially offset by a more favorable
current-year geographic mix of earnings. During the current year, net
adjustments to prior-year reserves balances for uncertain tax positions
benefitted the effective tax rate by 40 basis points versus a 130-basis
point benefit in the prior year. In 2009, the effective tax rate from
continuing operations was up 180 basis points to 25.9% primarily
due to a lower level of net favorable adjustments to reserves for
previously existing uncertain tax positions and geographic mix of
earnings across all reporting segments resulting from a weakening of
key foreign currencies versus the U.S. dollar, partially offset by the
utilization of tax credits. Net adjustments to reserves for uncertain tax
positions benefitted the effective tax rate by 130 basis points, versus
a benefit of 340 basis points in 2008.
Net Earnings
Net earnings from continuing operations were $10.9billion in 2010,
an increase of 2% versus the prior year due mainly to net sales growth
and operating margin expansion, partially offset by a higher effective
tax rate. Operating margin was up 30 basis points due to an increase
in gross margin, mostly offset by an increase in SG&A as a percentage
of net sales. Net earnings from continuing operations decreased 5%
to $10.7billion in 2009 mainly due to lower net sales and a higher
effective tax rate. Operating margin was down 20 basis points
behind a commodity-driven decline in gross margin, partially offset
by lower SG&A as a percentage of net sales.
Net earnings from discontinued operations declined $1.0billion to
$1.8billion in 2010 primarily due to the loss of contribution from the
pharmaceuticals business divested in October 2009 and coffee business
divested in November 2008 and lower gains on the sale of discontin-
ued operations. The gains on the sale of the global pharmaceuticals
business in fiscal 2010 were $1.6billion versus a $2.0billion gain on
the sale of the coffee business in fiscal 2009. In 2009, net earnings
from discontinued operations, which included the results of the coffee
and pharmaceuticals businesses, increased $2.0billion due to the gain
on the sale of the coffee business. The loss of earnings contribution
from the coffee business in 2009 was mostly offset by an increase in
earnings of the pharmaceuticals business.
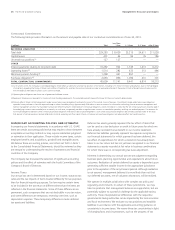
Diluted net earnings per share declined 4% to $4.11 in 2010 driven
by lower net earnings from discontinued operations, partially offset
by higher net earnings from continuing operations and a reduction in
weighted average shares outstanding resulting from share repurchase
activity. Diluted net earnings per share from continuing operations
increased 4% to $3.53 behind higher net earnings from continuing
operations and the reduction in shares outstanding. Diluted net
earnings per share from discontinued operations declined $0.29 to
$0.58. The reduction in the number of shares outstanding was driven
by treasury share repurchases of $6.0billion, nearly all of which were
made under our publicly announced share repurchase program. This
share repurchase program expired on June30, 2010.
Diluted net earnings per share in 2009 increased 17% to $4.26. The
increase was due mainly to the gain on the sale of our coffee business,
partially offset by lower net earnings from continuing operations.
Diluted net earnings per share from continuing operations in 2009
decreased $0.01 to $3.39. Diluted net earnings per share from discon-
tinued operations was $0.87, comprised primarily of the gain on the
sale of the coffee business and operating earnings of the pharmaceuti-
cals business. Diluted net earnings per share was positively impacted
by fewer shares outstanding as a result of share repurchase activity
and shares tendered in the Folgers coffee transaction. Treasury shares
in the amount of $6.4billion were repurchased in 2009, nearly all of
which were made under our publicly announced share repurchase
program.
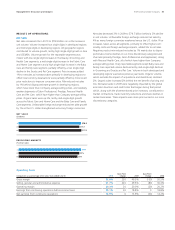
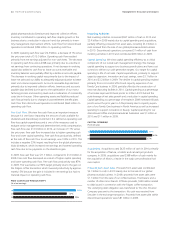
$3.64
$.
$4.26
10
08
09
DILUTED NET EARNINGS
(per common share)
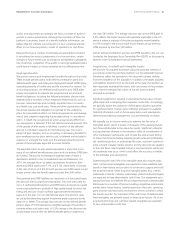
Core EPS was up 6% to $3.67 in 2010. Core EPS represents diluted
net earnings per share from continuing operations excluding charges
in 2010 for potential competition law fines and recently enacted
legislation which changed the taxation of certain future retiree pre-
scription drug subsidy payments in the United States, the 2009 impact
of incremental restructuring charges incurred to offset the dilutive
impact of the Folgers divestiture and the 2008 impact of significant
adjustments to tax reserves. Core EPS grew 6% in 2009 to $3.47.
$3.67
$3.26
$3.47
10
08
09
CORE EARNINGS PER SHARE
(per common share)