Proctor and Gamble 2010 Annual Report Download - page 53
Download and view the complete annual report
Please find page 53 of the 2010 Proctor and Gamble annual report below. You can navigate through the pages in the report by either clicking on the pages listed below, or by using the keyword search tool below to find specific information within the annual report.-
 1
1 -
2
-
3
-
4
-
5
-
6
-
7
-
8
-
9
-
10
-
11
-
12
-
13
-
14
-
15
-
16
-
17
-
18
-
19
-
20
-
21
-
22
-
23
-
24
-
25
-
26
-
27
-
28
-
29
-
30
-
31
-
32
-
33
-
34
-
35
-
36
-
37
-
38
-
39
-
40
-
41
-
42
-
 43
43 -
 44
44 -
 45
45 -
 46
46 -
 47
47 -
 48
48 -
 49
49 -
 50
50 -
 51
51 -
 52
52 -
 53
53 -
 54
54 -
 55
55 -
 56
56 -
 57
57 -
 58
58 -
 59
59 -
 60
60 -
 61
61 -
 62
62 -
 63
63 -
64
-
65
-
66
-
67
-
68
-
69
-
70
-
71
-
72
-
73
-
74
-
75
-
76
-
77
-
78
-
79
-
80
-
81
-
82
 |
 |

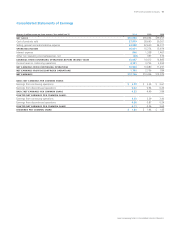
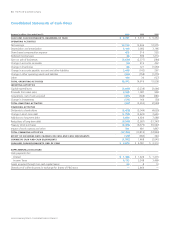
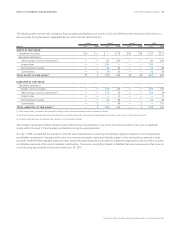
The Procter & Gamble Company 51
See accompanying Notes to Consolidated Financial Statements.
Consolidated Statements of Earnings
Amounts in millions except per share amounts; Years ended June 30 2010 2009 2008
NET SALES $78,938 $76,694 $79,257
Cost of products sold 37,919 38,690 39,261
Selling, general and administrative expense 24,998 22,630 24,017
OPERATING INCOME 16,021 15,374 15,979
Interest expense 946 1,358 1,467
Other non-operating income/(expense), net (28) 397 373
EARNINGS FROM CONTINUING OPERATIONS BEFORE INCOME TAXES 15,047 14,413 14,885
Income taxes on continuing operations 4,101 3,733 3,594
NET EARNINGS FROM CONTINUING OPERATIONS 10,946 10,680 11,291
NET EARNINGS FROM DISCONTINUED OPERATIONS 1,790 2,756 784
NET EARNINGS $12,736 $13,436 $12,075
BASIC NET EARNINGS PER COMMON SHARE:
Earnings from continuing operations $ 3.70 $ 3.55 $ 3.61
Earnings from discontinued operations 0.62 0.94 0.25
BASIC NET EARNINGS PER COMMON SHARE 4.32 4.49 3.86
DILUTED NET EARNINGS PER COMMON SHARE:
Earnings from continuing operations 3.53 3.39 3.40
Earnings from discontinued operations 0.58 0.87 0.24
DILUTED NET EARNINGS PER COMMON SHARE 4.11 4.26 3.64
DIVIDENDS PER COMMON SHARE $ 1.80 $ 1.64 $ 1.45