Proctor and Gamble 2010 Annual Report Download - page 4
Download and view the complete annual report
Please find page 4 of the 2010 Proctor and Gamble annual report below. You can navigate through the pages in the report by either clicking on the pages listed below, or by using the keyword search tool below to find specific information within the annual report.-
 1
1 -
 2
2 -
 3
3 -
 4
4 -
 5
5 -
 6
6 -
 7
7 -
 8
8 -
 9
9 -
 10
10 -
 11
11 -
 12
12 -
 13
13 -
 14
14 -
 15
15 -
16
-
17
-
18
-
19
-
20
-
21
-
22
-
23
-
24
-
25
-
26
-
27
-
28
-
29
-
30
-
31
-
32
-
33
-
34
-
35
-
36
-
37
-
38
-
39
-
40
-
41
-
42
-
43
-
44
-
45
-
46
-
47
-
48
-
49
-
50
-
51
-
52
-
53
-
54
-
55
-
56
-
57
-
58
-
59
-
60
-
61
-
62
-
63
-
64
-
65
-
66
-
67
-
68
-
69
-
70
-
71
-
72
-
73
-
74
-
75
-
76
-
77
-
78
-
79
-
80
-
81
-
82
 |
 |

• Core earnings per share grew 6%, roughly double our
going-in objective for the year.2
• Adjusted free cash flow was 125% of net earnings,
well above our target level.
We also made substantial progress toward profitable share
growth, a key priority. A year ago, our global market share
was down about half a point versus prior-year levels; today,
as I write this, our global market share is up nearly half a point
and accelerating. Last year, we were building market share
in businesses accounting for only about 33% of sales; today,
we are building share in brands and countries accounting
for about 66% of sales and P&G’s market share is growing in
14 of our top 17 countries.
In addition, we reached an additional 200 million
consumers, bringing the total served to 4.2 billion—on track
toward our goal of reaching 5 billion consumers by fiscal
2015. Average per capita spending on P&G products increased
in 70% of our top countries, up from 60% in fiscal 2009. And,
global household penetration—the percentage of households
using at least one P&G product—increased nearly two
percentage points, to 61%.
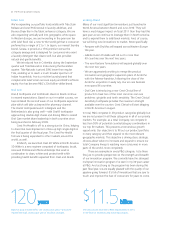
On the strength of these results, we paid approximately
$5.5 billion in dividends and returned $6 billion to
shareholders through the repurchase of P&G stock. Based
on our current market capitalization, dividends and share
repurchases provide shareholders with an effective cash
yield of more than 6%, with additional potential for capital
appreciation.
In April, we increased our quarterly dividend by 9.5%,
making this the 120th consecutive year that P&G has paid a
dividend and the 54th consecutive year that the dividend has
increased. Over those 54 years, the dividend has increased at
an annual compound average rate of approximately 9.5%.
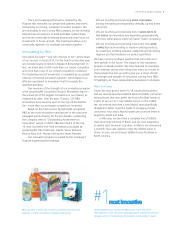
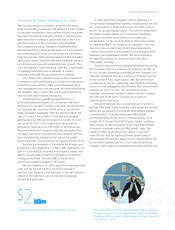
Last year, we updated P&G’s growth strategy to connect
it explicitly to our Company’s Purpose. We focused on three
specific choices: to grow P&G’s core brands and categories
with an unrelenting focus on innovation; to build our
business with unserved and underserved consumers; and
to continue to grow and develop faster-growing, higher-
margin businesses with global leadership potential.
These strategic choices are unified by one simple, over-
arching growth strategy: to touch and improve the lives
of MORE CONSUMERS in MORE PARTS OF THE WORLD, MORE
COMPLETELY. We’ve made this the centerpiece of our
leadership agenda because we believe a Purpose-inspired
growth strategy is intrinsically rewarding and motivating.
It unleashes creativity, commitment and peak performance
in P&G people. It attracts talent and partners. It builds
goodwill with external stakeholders.
We are executing across all three dimensions of this
growth strategy on all of our businesses around the world.
The Company’s performance in the 2010 fiscal year, and the
strength with which we have entered the 2011 fiscal year,
demonstrate that our Purpose-inspired growth strategy
is working.
Substantial Progress toward Growth Goals
We also renewed our growth goals last year. Our fundamental
objective is the creation of value for shareholders at industry
leadership levels on a consistent basis. More specifically,
our goal is to deliver total shareholder return that consistently
ranks P&G among the top-third of our peers—the best
performing consumer products companies in the world.
In addition, we measure our progress through a combination
of consumer and financial goals. We made substantial
progress in fiscal 2010:
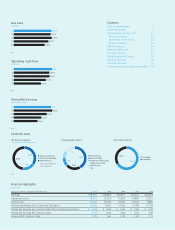
• Organic sales grew 3%, in line with Company expectations.1
2 The Procter & Gamble Company
Purpose-inspired Growth Strategy: Our path forward
(1) Organic sales growth is sales growth excluding the impacts of acquisitions, divestitures and foreign exchange
from year-over-year comparisons. See page 49 for a reconciliation of organic sales growth to net sales growth.
(2) Core EPS is a measure of the Company’s diluted net earnings per share from continuing operations excluding
charges for potential competition law fines, a charge related to a tax provision for retiree healthcare subsidy
payments in the recently enacted U.S. healthcare reform legislation and incremental Corporate restructuring
charges incurred in fiscal 2009 versus 2008 to offset the dilutive impact of the Folgers divestiture. See page 50
for a reconciliation of Core EPS to diluted net earnings per share from continuing operations.
(3) Adjusted free cash flow productivity is defined as the ratio of adjusted free cash flow to net earnings excluding
the gains on the divestiture of the global pharmaceuticals business. For 2010, adjusted free cash flow of
$13,985 million is operating cash flow of $16,072 million less capital spending of $3,067 million plus the tax
payments made on the gains from the global pharmaceuticals divestitures of $980 million. Adjusted free cash
flow productivity of 125% is adjusted free cash flow of $13,985 million divided by net earnings of $12,736
million less gains of $1,585 million from the global pharmaceuticals divestitures.
ORGANIC SALES GROWTH (1)
CORE EPS GROWTH (2)
ADJUSTED FREE CASH FLOW (3)
FY 2010
3%
6%
125% of net earnings
ANNUAL GROWTH TARGETS
1-2% above global market growth rates
High single to low double digits
90% of net earnings