Proctor and Gamble 2010 Annual Report Download - page 52
Download and view the complete annual report
Please find page 52 of the 2010 Proctor and Gamble annual report below. You can navigate through the pages in the report by either clicking on the pages listed below, or by using the keyword search tool below to find specific information within the annual report.-
 1
1 -
2
-
3
-
4
-
5
-
6
-
7
-
8
-
9
-
10
-
11
-
12
-
13
-
14
-
15
-
16
-
17
-
18
-
19
-
20
-
21
-
22
-
23
-
24
-
25
-
26
-
27
-
28
-
29
-
30
-
31
-
32
-
33
-
34
-
35
-
36
-
37
-
38
-
39
-
40
-
41
-
 42
42 -
 43
43 -
 44
44 -
 45
45 -
 46
46 -
 47
47 -
 48
48 -
 49
49 -
 50
50 -
 51
51 -
 52
52 -
 53
53 -
 54
54 -
 55
55 -
 56
56 -
 57
57 -
 58
58 -
 59
59 -
 60
60 -
 61
61 -
 62
62 -
63
-
64
-
65
-
66
-
67
-
68
-
69
-
70
-
71
-
72
-
73
-
74
-
75
-
76
-
77
-
78
-
79
-
80
-
81
-
82
 |
 |

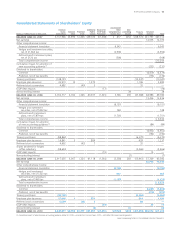
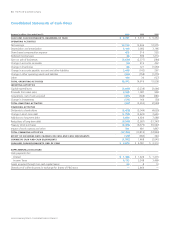
50 The Procter & Gamble Company Management’s Discussion and Analysis
Core EPS. Core EPS is a measure of the Company’s diluted net earnings
per share growth from continuing operations excluding certain items
that are not judged to be part of the Company’s sustainable results or
trends. This includes charges for potential competition law fines, a
charge related to recently enacted legislation which changed the
taxation of certain future retiree prescription drug subsidy payments
in the United States and the impact of incremental Corporate
restructuring charges incurred in fiscal 2009 versus 2008 to offset the
dilutive impact of the Folgers divestiture. We believe the Core EPS
measure provides an important perspective of underlying business
trends and results and provides a more comparable measure of year-on-
year earnings per share growth. Core EPS is also one of the measures
used to evaluate senior management and is a factor in determining
their at-risk compensation. The tables below provide reconciliations
of reported diluted net earnings per share from continuing operations
to Core EPS:
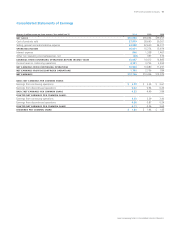
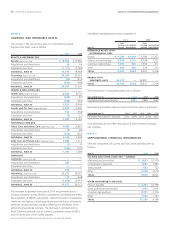
Years ended June 30 2010 2009 2008
Diluted Net Earnings Per Share —
Continuing Operations $3.53 $3.39 $3.40
Significant Adjustments to
Tax Reserves —— (0.14)
Incremental Folgers-related
Restructuring Charges —0.09 —
Charge for Taxation of Retiree
Healthcare Subsidy 0.05 — —
Charges for Potential Competition
Law Fines 0.09 — —
Rounding Impacts —(0.01) —
CORE EPS 3.67 3.47 3.26
Core EPS Growth 6% 6%
Note — All reconciling items are presented net of tax. Tax effects are calculated consistent with
the nature of the underlying transaction. The tax impact on the incremental Folgers-related
restructuring charges was ($0.02) for 2009. The entire amount of the charge for taxation of
retiree healthcare subsidy and significant adjustments to tax reserves are tax expense. There is
no tax impact on earnings per share due to the charges for potential competition law fines.
Free Cash Flow. Free cash flow is defined as operating cash flow less
capital spending. We view free cash flow as an important measure
because it is one factor in determining the amount of cash available
for dividends and discretionary investment. Free cash flow is also one
of the measures used to evaluate senior management and is a factor
in determining their at-risk compensation.
Free Cash Flow Productivity. Free cash flow productivity is defined as
the ratio of free cash flow to net earnings. Our target is to generate
free cash flow at or above 90% of net earnings. Free cash flow produc-
tivity is one of the measures used to evaluate senior management and
is a factor in determining their at-risk compensation.
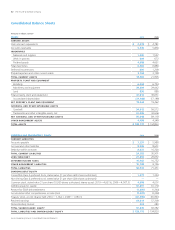
The following table provides a numerical reconciliation of free cash flow:
($millions)
Operating
Cash Flow
Capital
Spending
Free
Cash Flow
Net
Earnings
Free
Cash Flow
Productivity
2010 $16,072 $(3,067) $13,005 $12,736 102%
2009 14,919 (3,238) 11,681 13,436 87%
2008 15,008 (3,046) 11,962 12,075 99%