Proctor and Gamble 2010 Annual Report Download - page 54
Download and view the complete annual report
Please find page 54 of the 2010 Proctor and Gamble annual report below. You can navigate through the pages in the report by either clicking on the pages listed below, or by using the keyword search tool below to find specific information within the annual report.-
 1
1 -
2
-
3
-
4
-
5
-
6
-
7
-
8
-
9
-
10
-
11
-
12
-
13
-
14
-
15
-
16
-
17
-
18
-
19
-
20
-
21
-
22
-
23
-
24
-
25
-
26
-
27
-
28
-
29
-
30
-
31
-
32
-
33
-
34
-
35
-
36
-
37
-
38
-
39
-
40
-
41
-
42
-
43
-
 44
44 -
 45
45 -
 46
46 -
 47
47 -
 48
48 -
 49
49 -
 50
50 -
 51
51 -
 52
52 -
 53
53 -
 54
54 -
 55
55 -
 56
56 -
 57
57 -
 58
58 -
 59
59 -
 60
60 -
 61
61 -
 62
62 -
 63
63 -
 64
64 -
65
-
66
-
67
-
68
-
69
-
70
-
71
-
72
-
73
-
74
-
75
-
76
-
77
-
78
-
79
-
80
-
81
-
82
 |
 |

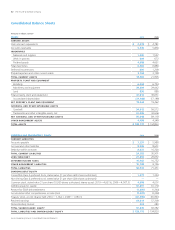
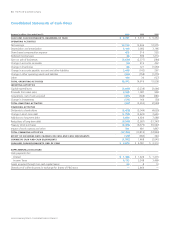
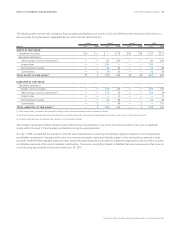
52 The Procter & Gamble Company
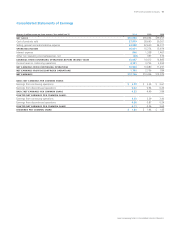
See accompanying Notes to Consolidated Financial Statements.
Consolidated Balance Sheets
Amounts in millions; June 30
Assets 2010 2009
CURRENT ASSETS
Cash and cash equivalents $ 2,879 $ 4,781
Accounts receivable 5,335 5,836
INVENTORIES
Materials and supplies 1,692 1,557
Work in process 604 672
Finished goods 4,088 4,651
Total inventories 6,384 6,880
Deferred income taxes 990 1,209
Prepaid expenses and other current assets 3,194 3,199
TOTAL CURRENT ASSETS 18,782 21,905
PROPERTY, PLANT AND EQUIPMENT
Buildings 6,868 6,724
Machinery and equipment 29,294 29,042
Land 850 885
Total property, plant and equipment 37,012 36,651
Accumulated depreciation (17,768) (17,189)
NET PROPERTY, PLANT AND EQUIPMENT 19,244 19,462
GOODWILL AND OTHER INTANGIBLE ASSETS
Goodwill 54,012 56,512
Trademarks and other intangible assets, net 31,636 32,606
NET GOODWILL AND OTHER INTANGIBLE ASSETS 85,648 89,118
OTHER NONCURRENT ASSETS 4,498 4,348
TOTAL ASSETS $ 128,172 $ 134,833
Liabilities and Shareholders’ Equity 2010 2009
CURRENT LIABILITIES
Accounts payable $ 7,251 $ 5,980
Accrued and other liabilities 8,559 8,601
Debt due within one year 8,472 16,320
TOTAL CURRENT LIABILITIES 24,282 30,901
LONG-TERM DEBT 21,360 20,652
DEFERRED INCOME TAXES 10,902 10,752
OTHER NONCURRENT LIABILITIES 10,189 9,146
TOTAL LIABILITIES 66,733 71,451
SHAREHOLDERS’ EQUITY
Convertible Class A preferred stock, stated value $1 per share (600 shares authorized) 1,277 1,324
Non-Voting Class B preferred stock, stated value $1 per share (200 shares authorized) — —
Common stock, stated value $1 per share (10,000 shares authorized; shares issued: 2010 — 4,007.6, 2009 — 4,007.3) 4,008 4,007
Additional paid-in capital 61,697 61,118
Reserve for ESOP debt retirement (1,350) (1,340)
Accumulated other comprehensive income (loss) (7,822) (3,358)
Treasury stock, at cost (shares held: 2010 — 1,164.1, 2009 — 1,090.3) (61,309) (55,961)
Retained earnings 64,614 57,309
Noncontrolling interest 324 283
TOTAL SHAREHOLDERS’ EQUITY 61,439 63,382
TOTAL LIABILITIES AND SHAREHOLDERS’ EQUITY $ 128,172 $ 134,833