Porsche 2005 Annual Report Download - page 135
Download and view the complete annual report
Please find page 135 of the 2005 Porsche annual report below. You can navigate through the pages in the report by either clicking on the pages listed below, or by using the keyword search tool below to find specific information within the annual report.-
 1
1 -
2
-
3
-
4
-
5
-
6
-
7
-
8
-
9
-
10
-
11
-
12
-
13
-
14
-
15
-
16
-
17
-
18
-
19
-
20
-
21
-
22
-
23
-
24
-
25
-
26
-
27
-
28
-
29
-
30
-
31
-
32
-
33
-
34
-
35
-
36
-
37
-
38
-
39
-
40
-
41
-
42
-
43
-
44
-
45
-
46
-
47
-
48
-
49
-
50
-
51
-
52
-
53
-
54
-
55
-
56
-
57
-
58
-
59
-
60
-
61
-
62
-
63
-
64
-
65
-
66
-
67
-
68
-
69
-
70
-
71
-
72
-
73
-
74
-
75
-
76
-
77
-
78
-
79
-
80
-
81
-
82
-
83
-
84
-
85
-
86
-
87
-
88
-
89
-
90
-
91
-
92
-
93
-
94
-
95
-
96
-
97
-
98
-
99
-
100
-
101
-
102
-
103
-
104
-
105
-
106
-
107
-
108
-
109
-
110
-
111
-
112
-
113
-
114
-
115
-
116
-
117
-
118
-
119
-
120
-
121
-
122
-
123
-
124
-
 125
125 -
 126
126 -
 127
127 -
 128
128 -
 129
129 -
 130
130 -
 131
131 -
 132
132 -
 133
133 -
 134
134 -
 135
135 -
 136
136 -
 137
137 -
 138
138 -
 139
139 -
 140
140 -
 141
141 -
 142
142 -
 143
143 -
 144
144 -
 145
145 -
146
-
147
-
148
-
149
-
150
-
151
-
152
-
153
-
154
-
155
-
156
-
157
-
158
-
159
-
160
-
161
-
162
-
163
-
164
-
165
-
166
 |
 |

133
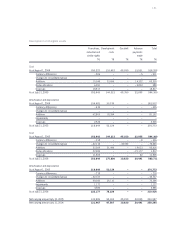
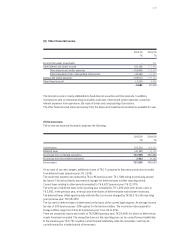
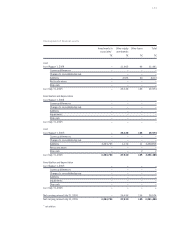
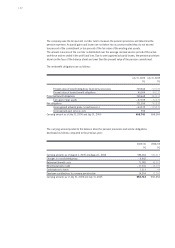
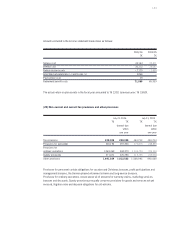
Development of financial assets
Investments in Other equity Other loans Total
associates* investments
T€ T€ T€ T€
Cost
As of August 1, 2004 – 21,865 96 21,961
Currency differences – – – –
Changes to consolidated group – – –
Additions – 4,573 40 4,613
Reclassifications – – – –
Disposals – – – –
As of July 31, 2005 – 26,438 136 26,574
Amortization and depreciation
As of August 1, 2004 – – – –
Currency differences – – – –
Changes to consolidated group – – – –
Additions – – – –
Impairments – – – –
Disposals – – – –
As of July 31, 2005 – – – –
Cost
As of August 1, 2005 –26,438 136 26,574
Currency differences – – – –
Changes to consolidated group – – – –
Additions 3,263,733 1,172 11 3,264,916
Reclassifications – – – –
Disposals – – 2 2
As of July 31, 2006 3,263,733 27,610 145 3,291,488
Amortization and depreciation
As of August 1, 2005 – – – –
Currency differences – – – –
Changes to consolidated group – – – –
Additions – – – –
Impairments – – – –
Disposals – – – –
As of July 31, 2006 – – – –
Net carrying amount July 31, 2005 – 26,438 136 26,574
Net carrying amount July 31, 2006 3,263,733 27,610 145 3,291,488
*net addition