Porsche 2005 Annual Report Download - page 110
Download and view the complete annual report
Please find page 110 of the 2005 Porsche annual report below. You can navigate through the pages in the report by either clicking on the pages listed below, or by using the keyword search tool below to find specific information within the annual report.-
 1
1 -
2
-
3
-
4
-
5
-
6
-
7
-
8
-
9
-
10
-
11
-
12
-
13
-
14
-
15
-
16
-
17
-
18
-
19
-
20
-
21
-
22
-
23
-
24
-
25
-
26
-
27
-
28
-
29
-
30
-
31
-
32
-
33
-
34
-
35
-
36
-
37
-
38
-
39
-
40
-
41
-
42
-
43
-
44
-
45
-
46
-
47
-
48
-
49
-
50
-
51
-
52
-
53
-
54
-
55
-
56
-
57
-
58
-
59
-
60
-
61
-
62
-
63
-
64
-
65
-
66
-
67
-
68
-
69
-
70
-
71
-
72
-
73
-
74
-
75
-
76
-
77
-
78
-
79
-
80
-
81
-
82
-
83
-
84
-
85
-
86
-
87
-
88
-
89
-
90
-
91
-
92
-
93
-
94
-
95
-
96
-
97
-
98
-
99
-
 100
100 -
 101
101 -
 102
102 -
 103
103 -
 104
104 -
 105
105 -
 106
106 -
 107
107 -
 108
108 -
 109
109 -
 110
110 -
 111
111 -
 112
112 -
 113
113 -
 114
114 -
 115
115 -
 116
116 -
 117
117 -
 118
118 -
 119
119 -
 120
120 -
121
-
122
-
123
-
124
-
125
-
126
-
127
-
128
-
129
-
130
-
131
-
132
-
133
-
134
-
135
-
136
-
137
-
138
-
139
-
140
-
141
-
142
-
143
-
144
-
145
-
146
-
147
-
148
-
149
-
150
-
151
-
152
-
153
-
154
-
155
-
156
-
157
-
158
-
159
-
160
-
161
-
162
-
163
-
164
-
165
-
166
 |
 |

108
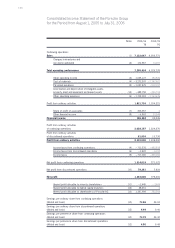
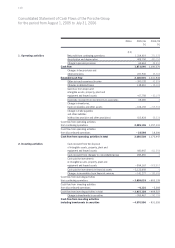
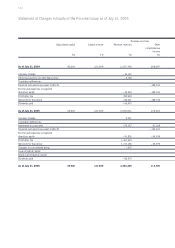
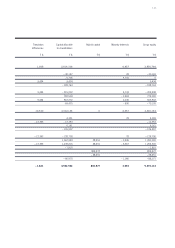
Consolidated Statement of Cash Flows of the Porsche Group
for the period from August 1, 2005 to July 31, 2006
Notes 2005/06 2004/05
T€ T€
(13)
Net profit from continuing operations 1,314,619 771,372
Amortization and depreciation 488,758 490,753
Change in pension provision 69,663 44,451
Cash flow 1,873,040 1,306,576
Changes in tax provision and
other provisions 227,530 25,362
Extended cash flow 2,100,570 1,331,938
Ohter non-cash expenses/income – 390,128 62,824
Changes in deferred taxes 138,910 – 18,303
Gain/loss from disposal of
intangible assets, property, plant and
equipment and leased assets – 67,758 – 62,079
Dividends received from investments in associates 68,280 0
Change in inventories,
trade receivables and other assets – 164,192 – 215,563
Change in trade payables
and other liabilities
(without tax provision and other provisions) 413,424 58,324
Cash flow from operating activities
from continuing operations 2,099,106 1,157,141
Cash flow from operating activities
from discontinued operations – 18,598 18,306
Cash flow from operating activities in total 2,080,508 1,175,447
Cash received from the disposal
of intangible assets, property, plant and
equipment and leased assets 440,647 411,354
Cash received from changes to consolidated group 168,436 0
Cash paid for investments
in intangible assets, property, plant and
equipment and leased assets – 954,167 – 908,807
Cash paid for investments in financial assets – 3,122,658 0
Changes in receivables from financial services – 141,277 – 185,686
Cash flow from investing activities
from continuing operations – 3,609,019 – 683,139
Cash flow from investing activities
from discontinued operations – 6,110 – 5,388
Cash flow from investing activities in total – 3,615,129 – 688,527
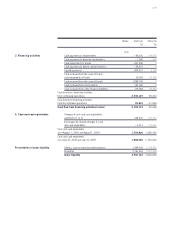
Change in investments in securities – 955,467 – 242,799
Cash flow from investing activities
including investments in securities – 4,570,596 – 931,326
1. Operating activities
2. Investing activities