Porsche 2005 Annual Report Download - page 127
Download and view the complete annual report
Please find page 127 of the 2005 Porsche annual report below. You can navigate through the pages in the report by either clicking on the pages listed below, or by using the keyword search tool below to find specific information within the annual report.-
 1
1 -
2
-
3
-
4
-
5
-
6
-
7
-
8
-
9
-
10
-
11
-
12
-
13
-
14
-
15
-
16
-
17
-
18
-
19
-
20
-
21
-
22
-
23
-
24
-
25
-
26
-
27
-
28
-
29
-
30
-
31
-
32
-
33
-
34
-
35
-
36
-
37
-
38
-
39
-
40
-
41
-
42
-
43
-
44
-
45
-
46
-
47
-
48
-
49
-
50
-
51
-
52
-
53
-
54
-
55
-
56
-
57
-
58
-
59
-
60
-
61
-
62
-
63
-
64
-
65
-
66
-
67
-
68
-
69
-
70
-
71
-
72
-
73
-
74
-
75
-
76
-
77
-
78
-
79
-
80
-
81
-
82
-
83
-
84
-
85
-
86
-
87
-
88
-
89
-
90
-
91
-
92
-
93
-
94
-
95
-
96
-
97
-
98
-
99
-
100
-
101
-
102
-
103
-
104
-
105
-
106
-
107
-
108
-
109
-
110
-
111
-
112
-
113
-
114
-
115
-
116
-
 117
117 -
 118
118 -
 119
119 -
 120
120 -
 121
121 -
 122
122 -
 123
123 -
 124
124 -
 125
125 -
 126
126 -
 127
127 -
 128
128 -
 129
129 -
 130
130 -
 131
131 -
 132
132 -
 133
133 -
 134
134 -
 135
135 -
 136
136 -
 137
137 -
138
-
139
-
140
-
141
-
142
-
143
-
144
-
145
-
146
-
147
-
148
-
149
-
150
-
151
-
152
-
153
-
154
-
155
-
156
-
157
-
158
-
159
-
160
-
161
-
162
-
163
-
164
-
165
-
166
 |
 |

123
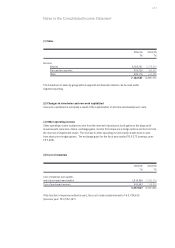
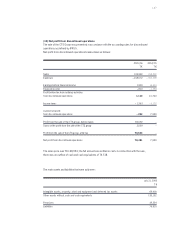
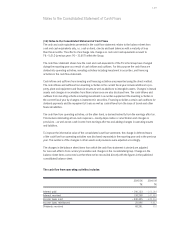
(2) Changes in inventories and own work capitalized
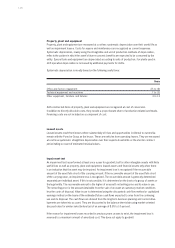
Own work capitalized is principally a result of the capitalization of vehicles and development costs.
(3) Other operating income
Other operating income includes income from the reversal of provisions, book gains on the disposal of
leased assets, insurance claims, exchange gains, income from share price hedge options and income from
the reversal of impairment losses. The increase in other operating income mainly results from income
from share price hedge options. The exchange gains for the fiscal year totaled T€ 9,373 (previous year:
T€ 7,405).
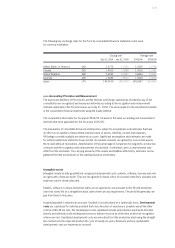
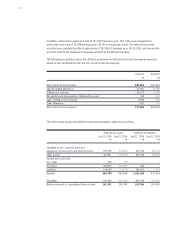
The breakdown of sales by geographical segment and business division can be seen under
segment reporting.
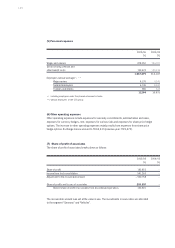
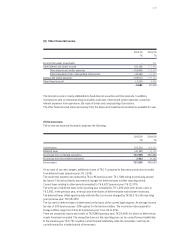
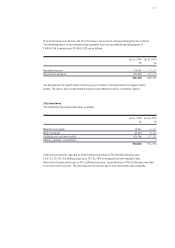
Notes to the Consolidated Income Statement
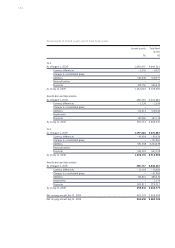
(1) Sales
2005/06 2004/05
T€ T€
Divisions
Vehicles 6,056,241 5,278,254
Parts and accessories 426,250 366,837
Other 640,176 610,680
7,122,667 6,255,771
(4) Cost of materials
If the function of expense method is used, the cost of sales would amount to T€ 3,734,615
(previous year: T€ 3,530,167).
2005/06 2004/05
T€ T€
Cost of materials and supplies
and of purchased merchandise 2,819,864 2,430,763
Cost of purchased services 453,643 316,838
3,273,507 2,747,601