Pfizer 2009 Annual Report Download - page 78
Download and view the complete annual report
Please find page 78 of the 2009 Pfizer annual report below. You can navigate through the pages in the report by either clicking on the pages listed below, or by using the keyword search tool below to find specific information within the annual report.-
 1
1 -
2
-
3
-
4
-
5
-
6
-
7
-
8
-
9
-
10
-
11
-
12
-
13
-
14
-
15
-
16
-
17
-
18
-
19
-
20
-
21
-
22
-
23
-
24
-
25
-
26
-
27
-
28
-
29
-
30
-
31
-
32
-
33
-
34
-
35
-
36
-
37
-
38
-
39
-
40
-
41
-
42
-
43
-
44
-
45
-
46
-
47
-
48
-
49
-
50
-
51
-
52
-
53
-
54
-
55
-
56
-
57
-
58
-
59
-
60
-
61
-
62
-
63
-
64
-
65
-
66
-
67
-
 68
68 -
 69
69 -
 70
70 -
 71
71 -
 72
72 -
 73
73 -
 74
74 -
 75
75 -
 76
76 -
 77
77 -
 78
78 -
 79
79 -
 80
80 -
 81
81 -
 82
82 -
 83
83 -
 84
84 -
 85
85 -
 86
86 -
 87
87 -
 88
88 -
89
-
90
-
91
-
92
-
93
-
94
-
95
-
96
-
97
-
98
-
99
-
100
-
101
-
102
-
103
-
104
-
105
-
106
-
107
-
108
-
109
-
110
 |
 |

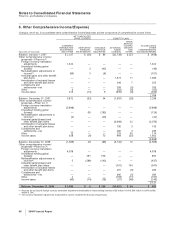
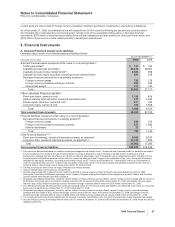
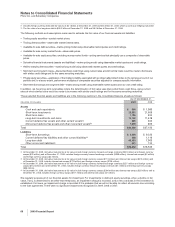
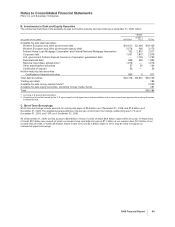
Notes to Consolidated Financial Statements
Pfizer Inc. and Subsidiary Companies
A. Components of Net Periodic Benefit Costs and Other Amounts Recognized in Other Comprehensive
(Income)/Expense
The annual cost and other amounts recognized in other comprehensive (income)/expense of the U.S. qualified, U.S. supplemental
(non-qualified) and international pension plans and postretirement plans follow:
YEAR ENDED DECEMBER 31,
PENSION PLANS
U.S. QUALIFIED
U.S. SUPPLEMENTAL
(NON-QUALIFIED) INTERNATIONAL
POSTRETIREMENT
PLANS
(MILLIONS OF DOLLARS) 2009 2008 2007 2009 2008 2007 2009 2008 2007 2009 2008 2007
Service cost $ 252 $ 236 $ 282 $24 $23 $ 27 $ 188 $ 249 $ 292 $39 $39 $42
Interest cost 526 459 447 53 38 55 342 388 349 145 141 137
Expected return on
plan assets (527) (646) (693) ———(375) (437) (381) (26) (35) (36)
Amortization of:
Actuarial losses 212 32 65 31 29 45 30 43 96 18 28 42
Prior service
costs/(credits) 238(2) (2) (2) (3) 1— (3) 11
Curtailments and
settlements—net 110 32 58 (2) 120 5 43 (155) (3) 10 5
Special termination
benefits 61 30 16 137 —— 825 29 24 17 17
Less: Amounts
included in
discontinued
operations —— (27) ——— ——— ———
Net periodic benefit
costs 636 146 156 241 208 130 194 272 230 194 201 208
Other changes
recognized in
other
comprehensive
(income)/
expense(a) (783) 2,273 (582) (23) (52) (134) 806 415 (808) (122) (140) (311)
Total recognized in
net periodic
benefit costs and
other
comprehensive
(income)/expense $(147) $2,419 $(426) $218 $156 $ (4) $1,000 $ 687 $(578) $72 $ 61 $(103)
(a) For details, see Note 8. Other Comprehensive Income/(Expense).
The increase in the 2009 U.S. qualified pension plans’ net periodic benefit costs compared to 2008 was largely driven by the
securities market downturn during 2008 and by charges resulting from employee terminations associated with our cost-reduction
initiatives. The securities market downturn during 2008 contributed to a lower plan asset base and higher actuarial losses
recognized. The decrease in the 2008 U.S. qualified pension plans’ net periodic benefit costs compared to 2007 was largely driven
by the increase in the discount rate and the impact of our cost-reduction initiatives.
The increase in the 2009 U.S. supplemental (non-qualified) plans’ net periodic benefit costs compared to 2008 was largely driven by
the impact of special termination benefits recognized for certain executives as part of Wyeth-related restructuring initiatives. The
increase in the 2008 U.S. supplemental (non-qualified) plans’ net periodic benefit costs compared to 2007 was largely driven by
settlement charges recognized due to lump sum benefit payments made to certain former executives in 2008.
The decrease in the 2009 international plans’ net periodic benefit costs compared to 2008 was largely driven by an increase in
interest rates set at the beginning of the year and ongoing restructuring and certain acquisition-related activities, which was partially
offset by lower expected returns on plan assets. The increase in the 2008 international plans’ net periodic benefit costs compared to
2007 was attributable to a settlement gain of $106 million resulting from a transfer of pension obligations, along with the respective
plan assets, to the Japanese government in accordance with Japanese laws, which was partially offset by higher expected return on
plan assets during 2008.
76 2009 Financial Report