Pfizer 2009 Annual Report Download - page 20
Download and view the complete annual report
Please find page 20 of the 2009 Pfizer annual report below. You can navigate through the pages in the report by either clicking on the pages listed below, or by using the keyword search tool below to find specific information within the annual report.-
 1
1 -
2
-
3
-
4
-
5
-
6
-
7
-
8
-
9
-
 10
10 -
 11
11 -
 12
12 -
 13
13 -
 14
14 -
 15
15 -
 16
16 -
 17
17 -
 18
18 -
 19
19 -
 20
20 -
 21
21 -
 22
22 -
 23
23 -
 24
24 -
 25
25 -
 26
26 -
 27
27 -
 28
28 -
 29
29 -
 30
30 -
31
-
32
-
33
-
34
-
35
-
36
-
37
-
38
-
39
-
40
-
41
-
42
-
43
-
44
-
45
-
46
-
47
-
48
-
49
-
50
-
51
-
52
-
53
-
54
-
55
-
56
-
57
-
58
-
59
-
60
-
61
-
62
-
63
-
64
-
65
-
66
-
67
-
68
-
69
-
70
-
71
-
72
-
73
-
74
-
75
-
76
-
77
-
78
-
79
-
80
-
81
-
82
-
83
-
84
-
85
-
86
-
87
-
88
-
89
-
90
-
91
-
92
-
93
-
94
-
95
-
96
-
97
-
98
-
99
-
100
-
101
-
102
-
103
-
104
-
105
-
106
-
107
-
108
-
109
-
110
 |
 |

Financial Review
Pfizer Inc. and Subsidiary Companies
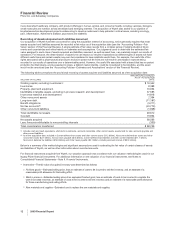
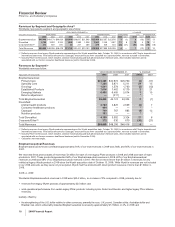
Revenues by Segment and Geographic Area(a)
Worldwide revenues by segment and geographic area follow:
(MILLIONS OF DOLLARS)
YEAR ENDED DECEMBER 31, % CHANGE
WORLDWIDE U.S. INTERNATIONAL WORLDWIDE U.S. INTERNATIONAL
2009 2008 2007 2009 2008 2007 2009 2008 2007 09/08 08/07 09/08 08/07 09/08 08/07
Biopharmaceutical $45,448 $44,174 $44,424 $20,010 $18,817 $21,548 $25,438 $25,357 $22,876 3(1) 6(13) —11
Diversified 4,189 3,592 3,324 1,646 1,383 1,336 2,543 2,209 1,987 17 819 415 11
Corporate/Other(b) 372 530 670 93 201 269 279 329 402 (30) (21) (54) (25) (15) (18)
Total Revenues $50,009 $48,296 $48,418 $21,749 $20,401 $23,153 $28,260 $27,895 $25,265 4—7(12) 110
(a) Reflects revenues from legacy Wyeth products commencing on the Wyeth acquisition date, October 15, 2009, in accordance with Pfizer’s domestic and
international year-ends. Prior-period amounts for Capsugel, which previously were classified as Corporate/Other, now are included in Diversified.
(b) Includes Pfizer Centersource, which includes contract manufacturing and bulk pharmaceutical chemical sales. Also includes transition activity
associated with our former consumer healthcare business (sold in December 2006).
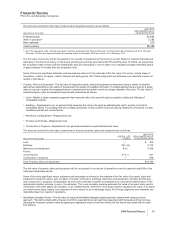
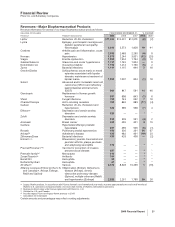
Revenues by Segment(a)
Worldwide revenues follow:
YEAR ENDED DECEMBER 31, % CHANGE
(MILLIONS OF DOLLARS) 2009 2008 2007 09/08 08/07
Biopharmaceutical:
Primary Care $22,489 $22,974 $25,700 (2) (11)
Specialty Care 7,386 5,971 5,211 24 15
Oncology 1,501 1,579 1,760 (5) (10)
Established Products 7,616 7,462 6,179 221
Emerging Markets 6,456 6,405 5,574 115
Returns adjustment —(217) — **
Total Biopharmaceutical 45,448 44,174 44,424 3(1)
Diversified:
Animal health products 2,764 2,825 2,639 (2) 7
Consumer healthcare products 494 —— **
Capsugel 740 767 685 (4) 12
Nutrition products 191 —— **
Total Diversified 4,189 3,592 3,324 17 8
Corporate/Other(b) 372 530 670 (30) (21)
Total Revenues $50,009 $48,296 $48,418 4—
(a) Reflects revenues from legacy Wyeth products commencing on the Wyeth acquisition date, October 15, 2009, in accordance with Pfizer’s domestic and
international year-ends. Prior-period amounts for Capsugel, which previously were classified as Corporate/Other, now are included in Diversified.
(b) Includes Pfizer Centersource, which includes contract manufacturing and bulk pharmaceutical chemical sales. Also includes transition activity
associated with our former consumer healthcare business (sold in December 2006).
* Calculation not meaningful.
Biopharmaceutical Revenues
Biopharmaceutical revenues contributed approximately 91% of our total revenues in 2009 and 2008, and 92% of our total revenues in
2007.
We recorded direct product sales of more than $1 billion for each of nine legacy Pfizer products in 2009 and 2008 and each of eight
products in 2007. These products represented 56% of our Biopharmaceutical revenues in 2009, 60% of our Biopharmaceutical
revenues in 2008 and 58% of our Biopharmaceutical revenues in 2007. We did not record more than $1 billion in revenues for any
individual legacy Wyeth product in 2009 since the Wyeth acquisition date of October 15, 2009. While Wyeth’s revenues are not included
in our 2008 amounts, as they were not yet acquired, Wyeth had five products with direct product revenues of more than $1 billion in
2008.
2009 vs. 2008
Worldwide Biopharmaceutical revenues in 2009 were $45.4 billion, an increase of 3% compared to 2008, primarily due to:
•revenues from legacy Wyeth products of approximately $2.5 billion; and
•solid operational performance from certain legacy Pfizer products, including Lyrica, Sutent and Revatio, and higher legacy Pfizer alliance
revenues,
partially offset by:
•the strengthening of the U.S. dollar relative to other currencies, primarily the euro, U.K. pound, Canadian dollar, Australian dollar and
Brazilian real, which unfavorably impacted Biopharmaceutical revenues by approximately $1.7 billion, or 4%, in 2009; and
18 2009 Financial Report