Pfizer 2009 Annual Report Download - page 40
Download and view the complete annual report
Please find page 40 of the 2009 Pfizer annual report below. You can navigate through the pages in the report by either clicking on the pages listed below, or by using the keyword search tool below to find specific information within the annual report.-
 1
1 -
2
-
3
-
4
-
5
-
6
-
7
-
8
-
9
-
10
-
11
-
12
-
13
-
14
-
15
-
16
-
17
-
18
-
19
-
20
-
21
-
22
-
23
-
24
-
25
-
26
-
27
-
28
-
29
-
 30
30 -
 31
31 -
 32
32 -
 33
33 -
 34
34 -
 35
35 -
 36
36 -
 37
37 -
 38
38 -
 39
39 -
 40
40 -
 41
41 -
 42
42 -
 43
43 -
 44
44 -
 45
45 -
 46
46 -
 47
47 -
 48
48 -
 49
49 -
 50
50 -
51
-
52
-
53
-
54
-
55
-
56
-
57
-
58
-
59
-
60
-
61
-
62
-
63
-
64
-
65
-
66
-
67
-
68
-
69
-
70
-
71
-
72
-
73
-
74
-
75
-
76
-
77
-
78
-
79
-
80
-
81
-
82
-
83
-
84
-
85
-
86
-
87
-
88
-
89
-
90
-
91
-
92
-
93
-
94
-
95
-
96
-
97
-
98
-
99
-
100
-
101
-
102
-
103
-
104
-
105
-
106
-
107
-
108
-
109
-
110
 |
 |

Financial Review
Pfizer Inc. and Subsidiary Companies
partially offset by:
•net borrowings of $2.4 billion in 2008 compared to net borrowings of $4.9 billion in 2007; and
•cash dividends paid of $8.5 billion in 2008 compared to $8.0 billion in 2007, primarily reflecting an increase in the dividend rate.
On June 23, 2005, we announced that the Board of Directors authorized a $5 billion share-purchase plan (the “2005 Stock Purchase
Plan”). On June 26, 2006, we announced that the Board of Directors increased the authorized amount of shares to be purchased
under the 2005 Stock Purchase Plan from $5 billion to $18 billion. On January 23, 2008, we announced that the Board of Directors
had authorized a new $5 billion share-purchase plan, to be funded by operating cash flows that may be utilized from time to time. In
total, under the 2005 Stock Purchase Plan, through December 31, 2009, we purchased approximately 710 million shares for
approximately $18.0 billion. We did not purchase any shares of our common stock in 2009. During 2008, we purchased 26 million
shares of our common stock at an average price per share of $18.96, and during 2007, we purchased 395 million shares at an
average price per share of $25.27.
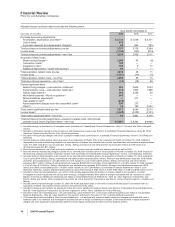
Contractual Obligations
Payments due under contractual obligations as of December 31, 2009, mature as follows:
YEARS
(MILLIONS OF DOLLARS) TOTAL WITHIN 1
OVER 1
TO 3
OVER 3
TO 5 AFTER 5
Long-term debt(a) $67,409 $2,028 $11,363 $11,537 $42,481
Other long-term liabilities reflected on our consolidated balance sheet under
U.S. GAAP(b) 5,412 579 1,023 1,075 2,735
Lease commitments(c) 1,722 269 333 219 901
Purchase obligations and other(d) 4,785 1,107 1,761 973 944
Uncertain tax positions(e) 362 362 — — —
(a) Our long-term debt obligations include both our expected principal and interest obligations. Our calculations of expected interest payments
incorporate only current period assumptions for interest rates, foreign currency translation rates and hedging strategies (see Notes to Consolidated
Financial Statements—Note 9. Financial Instruments). Long-term debt consists of senior, unsecured notes; floating rate; unsecured notes; foreign
currency denominated notes; and other borrowings and mortgages.
(b) Includes expected payments relating to our unfunded U.S. supplemental (non-qualified) pension plans, postretirement plans and deferred
compensation plans.
(c) Includes operating and capital lease obligations.
(d) Includes agreements to purchase goods and services that are enforceable and legally binding and includes amounts relating to advertising,
information technology services, employee benefit administration services, and potential milestone payments deemed reasonably likely to occur.
(e) Except for amounts reflected in Income taxes payable, we are unable to predict the timing of tax settlements, as tax audits can involve complex issues
and the resolution of those issues may span multiple years, particularly if subject to negotiation or litigation.
The above table excludes amounts for potential milestone payments under collaboration, licensing or other arrangements unless the
payments are deemed reasonably likely to occur. Payments under these agreements generally become due and payable only upon
the achievement of certain development, regulatory and/or commercialization milestones, which may span several years and which
may never occur.
In 2010, we expect to spend approximately $2.2 billion on property, plant and equipment. Planned capital spending mostly
represents investment to maintain existing facilities and capacity. We rely largely on operating cash flow to fund our capital
investment needs. Due to our significant operating cash flow, we believe we have the ability to meet our capital investment needs
and foresee no delays to planned capital expenditures.
Off-Balance Sheet Arrangements
In the ordinary course of business and in connection with the sale of assets and businesses, we often indemnify our counterparties
against certain liabilities that may arise in connection with a transaction or that are related to activities prior to a transaction. These
indemnifications typically pertain to environmental, tax, employee and/or product-related matters, and patent infringement claims. If
the indemnified party were to make a successful claim pursuant to the terms of the indemnification, we would be required to
reimburse the loss. These indemnifications generally are subject to threshold amounts, specified claim periods and other restrictions
and limitations. Historically, we have not paid significant amounts under these provisions and, as of December 31, 2009, recorded
amounts for the estimated fair value of these indemnifications are not significant.
Certain of our co-promotion or license agreements give our licensors or partners the rights to negotiate for, or in some cases to
obtain under certain financial conditions, co-promotion or other rights in specified countries with respect to certain of our products.
Dividends on Common Stock
We declared dividends of $5.5 billion in 2009 and $8.6 billion in 2008 on our common stock. In December 2009, our Board of
Directors declared a first-quarter 2010 dividend of $0.18 per share. The first-quarter 2010 cash dividend will be our 285th
consecutive quarterly dividend.
Our current and projected dividends provide a return to shareholders while maintaining sufficient capital to invest in growing our
businesses and increasing shareholder value. Our dividends are funded from operating cash flows, our financial asset portfolio and
short-term commercial paper borrowings and are not restricted by debt covenants. We believe that our profitability and access to
38 2009 Financial Report