Motorola 2014 Annual Report Download - page 81
Download and view the complete annual report
Please find page 81 of the 2014 Motorola annual report below. You can navigate through the pages in the report by either clicking on the pages listed below, or by using the keyword search tool below to find specific information within the annual report.-
 1
1 -
2
-
3
-
4
-
5
-
6
-
7
-
8
-
9
-
10
-
11
-
12
-
13
-
14
-
15
-
16
-
17
-
18
-
19
-
20
-
21
-
22
-
23
-
24
-
25
-
26
-
27
-
28
-
29
-
30
-
31
-
32
-
33
-
34
-
35
-
36
-
37
-
38
-
39
-
40
-
41
-
42
-
43
-
44
-
45
-
46
-
47
-
48
-
49
-
50
-
51
-
52
-
53
-
54
-
55
-
56
-
57
-
58
-
59
-
60
-
61
-
62
-
63
-
64
-
65
-
66
-
67
-
68
-
69
-
70
-
 71
71 -
 72
72 -
 73
73 -
 74
74 -
 75
75 -
 76
76 -
 77
77 -
 78
78 -
 79
79 -
 80
80 -
 81
81 -
 82
82 -
 83
83 -
 84
84 -
 85
85 -
 86
86 -
 87
87 -
 88
88 -
 89
89 -
 90
90 -
 91
91 -
92
-
93
-
94
-
95
-
96
-
97
-
98
-
99
-
100
-
101
-
102
-
103
-
104
 |
 |

79
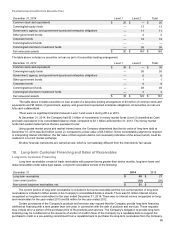
Non-U.S. Pension Benefit Plans
December 31, 2014 Level 1 Level 2 Total
Common stock and equivalents $ 194 $ — $ 194
Commingled equity funds — 569 569
Government, agency, and government-sponsored enterprise obligations — 26 26
Corporate bonds — 316 316
Commingled bond funds — 399 399
Commingled short-term investment funds — 9 9
Total investment securities $ 194 $ 1,319 $ 1,513
Cash 233
Accrued income receivable 5
Insurance contracts 55
Fair value plan assets $ 1,806
The table above includes securities on loan as part of a securities lending arrangement of $16 million of common stock
and equivalents and $12 million of corporate bonds. All securities on loan are fully collateralized.
The following table summarizes the changes in fair value of the Level 3 assets:
2014
Balance at January 1 $ 26
Transfers to Level 2 (14)
Loss on assets held (1)
Payments received for securities sold (10)
Purchases 1
Other (2)
Balance at December 31 $ —
December 31, 2013 Level 1 Level 2 Level 3 Total
Common stock and equivalents $ 172 $ — $ — $ 172
Commingled equity funds — 558 — 558
Government, agency, and government-sponsored enterprise
obligations — 21 3 24
Corporate bonds — 289 23 312
Commingled bond funds — 361 — 361
Commingled short-term investment funds — 11 — 11
Total investment securities $ 172 $ 1,240 $ 26 $ 1,438
Accrued income receivable 61
Insurance contracts 14
Fair value plan assets $ 1,513
The table above includes securities on loan as part of a securities lending arrangement of $8 million of common stock and
equivalents, and $13 million of corporate bonds. All securities on loan are fully collateralized.
There were no significant transfers between Level 1 and Level 2 during 2014 or 2013.