Motorola 2014 Annual Report Download - page 33
Download and view the complete annual report
Please find page 33 of the 2014 Motorola annual report below. You can navigate through the pages in the report by either clicking on the pages listed below, or by using the keyword search tool below to find specific information within the annual report.-
 1
1 -
2
-
3
-
4
-
5
-
6
-
7
-
8
-
9
-
10
-
11
-
12
-
13
-
14
-
15
-
16
-
17
-
18
-
19
-
20
-
21
-
22
-
 23
23 -
 24
24 -
 25
25 -
 26
26 -
 27
27 -
 28
28 -
 29
29 -
 30
30 -
 31
31 -
 32
32 -
 33
33 -
 34
34 -
 35
35 -
 36
36 -
 37
37 -
 38
38 -
 39
39 -
 40
40 -
 41
41 -
 42
42 -
 43
43 -
44
-
45
-
46
-
47
-
48
-
49
-
50
-
51
-
52
-
53
-
54
-
55
-
56
-
57
-
58
-
59
-
60
-
61
-
62
-
63
-
64
-
65
-
66
-
67
-
68
-
69
-
70
-
71
-
72
-
73
-
74
-
75
-
76
-
77
-
78
-
79
-
80
-
81
-
82
-
83
-
84
-
85
-
86
-
87
-
88
-
89
-
90
-
91
-
92
-
93
-
94
-
95
-
96
-
97
-
98
-
99
-
100
-
101
-
102
-
103
-
104
 |
 |

31
Gains on Sales of Investments
Gains on sales of investments and businesses were $37 million in 2013, compared to $26 million in 2012. These gains
consist of gains on the sale of multiple equity investments in both 2013 and 2012.
Other
Net Other income was $9 million in 2013, compared to net Other income of $1 million in 2012. The net Other income in
2013 was primarily comprised of: (i) $10 million of equity method investment earnings and (ii) $11 million of other non-operating
gains, partially offset by: (i) a $9 million loss on foreign currency and (ii) investment impairments of $3 million. The net Other
income in 2012 was primarily comprised of: (i) $3 million of equity method investment earnings and (ii) $9 million of other non-
operating gains, partially offset by: (i) $6 million loss from the extinguishment of debt and (ii) investment impairments of $4
million.
Effective Tax Rate
We recorded $59 million of net tax benefit in 2013, resulting in a negative effective tax rate of 7%, compared to $211 million
of net tax expense in 2012, resulting in an effective tax rate of 24%. Our effective tax rate in 2013 was favorably impacted by: (i)
$337 million of net tax benefit, or $1.25 of diluted earnings per share from continuing operations, associated with excess foreign
tax credits, (ii) a $25 million reduction in our deferred tax liability for undistributed foreign earnings primarily due to our assertion
that certain earnings are now permanently reinvested, and (iii) a $9 million tax benefit for prior year R&D tax credits. The tax
benefit associated with the excess foreign tax credits relates to the earnings of certain non-U.S. subsidiaries reorganized under
our holding company structure implemented during 2013. Our effective tax rate in 2013 was unfavorably impacted by a $20
million tax charge associated with the liquidation of the Sigma Fund, as discussed within "Liquidity and Capital Resources."
Our effective tax rate in 2012 was lower than the U.S. statutory tax rate of 35% primarily due to: (i) a $60 million tax benefit
related to the reversal of a significant portion of the valuation allowance established on certain foreign deferred tax assets and
(ii) a $13 million reduction in unrecognized tax benefits for facts that then indicated the extent to which certain tax positions were
more-likely-than-not of being sustained.
Earnings from Continuing Operations Attributable to Motorola Solutions, Inc.
We had net earnings from continuing operations attributable to Motorola Solutions, Inc. of $933 million, or $3.45 per diluted
share, in 2013, compared to $670 million, or $2.25 per diluted share, in 2012.
The increase in net earnings from continuing operations attributable to Motorola Solutions, Inc. in 2013, as compared to
2012, was primarily driven by: (i) a lower effective tax rate due to the $337 million net tax benefit associated with foreign tax
credits and (ii) decreased defined benefit expenses of over $100 million, partially offset by: (i) a $85 million decrease in gross
margin, (ii) a $43 million increase in reorganization of business charges, and (iii) a $47 million increase in net interest expense.
The increase in earnings per diluted share from continuing operations was driven by higher net earnings as well as the reduction
in shares outstanding as a result of our share repurchase program.
Earnings from Discontinued Operations
In 2013, we had $166 million in earnings from discontinued operations, net of tax, or $0.61 per diluted share, compared to
$211 million of earnings from discontinued operations, net of tax, or $0.71 per diluted share, in 2012. The earnings from
discontinued operations in 2013 and 2012 were primarily from the Enterprise business. The decrease from 2012 to 2013 is
primarily related to an increase in amortization of intangible assets, as a result of the purchase of Psion at the end of 2012.
Segment Information
The following commentary should be read in conjunction with the financial results of each operating business segment as
detailed in Note 12, “Information by Segment and Geographic Region,” to our consolidated financial statements. Net sales and
operating results for our two segments for 2014, 2013, and 2012 are presented below.
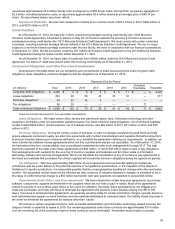
Products Segment
In 2014, the Products segment’s net sales represented 65% of our consolidated net sales, compared to 66% in 2013 and
68% in 2012.
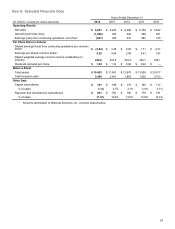
Years ended December 31 Percent Change
(Dollars in millions) 2014 2013 2012 2014—2013 2013—2012
Segment net sales $ 3,807 $ 4,109 $ 4,236 (7)% (3)%
Operating earnings (loss) (667) 639 656 (204)% (3)%
Segment Results—2014 Compared to 2013
In 2014, the segment’s net sales were $3.8 billion, a 7% decrease compared to 2013 reflecting a decrease in: (i) devices
sales in North America, Latin America, and APME, partially offset by an increase in devices sales within EA and (ii) system sales
in North America, APME and EA, partially offset by an increase in system sales in Latin America. On a geographic basis, net
sales declined in North America, Latin America and APME, and increased in EA in 2014 compared to 2013. The fourth quarter of
2014 was positively impacted by a return to growth in the North America region, as compared to the fourth quarter of 2013, and