Motorola 2014 Annual Report Download - page 42
Download and view the complete annual report
Please find page 42 of the 2014 Motorola annual report below. You can navigate through the pages in the report by either clicking on the pages listed below, or by using the keyword search tool below to find specific information within the annual report.-
 1
1 -
2
-
3
-
4
-
5
-
6
-
7
-
8
-
9
-
10
-
11
-
12
-
13
-
14
-
15
-
16
-
17
-
18
-
19
-
20
-
21
-
22
-
23
-
24
-
25
-
26
-
27
-
28
-
29
-
30
-
31
-
 32
32 -
 33
33 -
 34
34 -
 35
35 -
 36
36 -
 37
37 -
 38
38 -
 39
39 -
 40
40 -
 41
41 -
 42
42 -
 43
43 -
 44
44 -
 45
45 -
 46
46 -
 47
47 -
 48
48 -
 49
49 -
 50
50 -
 51
51 -
 52
52 -
53
-
54
-
55
-
56
-
57
-
58
-
59
-
60
-
61
-
62
-
63
-
64
-
65
-
66
-
67
-
68
-
69
-
70
-
71
-
72
-
73
-
74
-
75
-
76
-
77
-
78
-
79
-
80
-
81
-
82
-
83
-
84
-
85
-
86
-
87
-
88
-
89
-
90
-
91
-
92
-
93
-
94
-
95
-
96
-
97
-
98
-
99
-
100
-
101
-
102
-
103
-
104
 |
 |

40
the undelivered elements is deferred and the remaining portion of the arrangement consideration is allocated to the delivered
elements and is recognized as revenue.
Inventory Valuation
We record valuation reserves on our inventory for estimated excess or obsolescence. The amount of the reserve is equal
to the difference between the cost of the inventory and the estimated market value based upon assumptions about future
demand and market conditions. On a quarterly basis, management performs an analysis based on future demand requirement
estimates of the underlying inventory to identify reserves needed for excess and obsolescence. We use our best judgment to
estimate appropriate reserves based on this analysis. In addition, we adjust the carrying value of inventory if the current market
value of that inventory is below our cost.
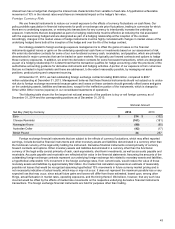
At December 31, 2014 and 2013, Inventories consisted of the following:
December 31 2014 2013
Finished goods $ 163 $ 157
Work-in-process and production materials 313 315
476 472
Less inventory reserves (131) (125)
$ 345 $ 347
We balance the need to maintain strategic inventory levels to ensure competitive delivery performance to our customers
against the risk of inventory obsolescence due to rapidly changing technology and customer requirements. As reflected above,
our inventory reserves represented 28% of the gross inventory balance at December 31, 2014, compared to 26% of the gross
inventory balance at December 31, 2013. We have inventory reserves for excess inventory, pending cancellations of product
lines due to technology changes, long-life cycle products, lifetime buys at the end of supplier production runs, business exits,
and a shift of production to outsourced manufacturing.
If future demand or market conditions are less favorable than those projected by management, additional inventory
writedowns may be required.
Income Taxes
Our effective tax rate is based on pre-tax income and the tax rates applicable to such income in the various jurisdictions in
which we operate. An estimated effective tax rate for the year is applied to our quarterly operating results. In the event that there
is a significant unusual or discrete item recognized, or expected to be recognized, in our quarterly operating results, the tax
attributable to that item is separately calculated and recorded at the same time as the unusual or discrete item. We consider the
resolution of prior year tax matters to be such items. Significant judgment is required in determining our effective tax rate and in
evaluating our tax positions. We adjust reserves for unrecognized income tax benefits in light of changing facts and
circumstances. We recognize the tax benefit of a tax position only if it is more-likely-than-not to be sustained.
Tax regulations may require items of income and expense to be included in a tax return in different periods than the items
are reflected in the consolidated financial statements. As a result, the effective tax rate reflected in the consolidated financial
statements may be different than the tax rate reported in the income tax return. Some of these differences are permanent, such
as expenses that are not deductible on the tax return, and some are temporary differences, such as depreciation expense.
Temporary differences create deferred tax assets and liabilities. Deferred tax assets generally represent items that can be used
as a tax deduction or credit in the tax return in future years for which we have already recorded the tax benefit in the
consolidated financial statements. Deferred tax liabilities generally represent tax expense recognized in the consolidated
financial statements for which the tax payment has been deferred or expense for which we have already taken a deduction on
an income tax return, but has not yet been recognized in the consolidated financial statements.
We account for income taxes by recognizing deferred tax assets and liabilities using enacted tax rates for the effect of the
temporary differences between the book and tax basis of recorded assets and liabilities. We make estimates and judgments with
regard to the calculation of certain income tax assets and liabilities. Deferred tax assets are reduced by valuation allowances if,
based on the consideration of all available evidence, it is more-likely-than-not that all or some portion of the deferred tax asset
will not be realized. Significant weight is given to evidence that can be objectively verified.
We evaluate deferred income taxes on a quarterly basis to determine if valuation allowances are required by considering
available evidence, including historical and projected taxable income and tax planning strategies that are both prudent and
feasible.
During 2014, the movement in our deferred tax valuation allowances primarily relates to deferred tax assets that are not
more-likely-than-not to be realizable based on estimates of future taxable income, net of expiration of carryforwards. During
2013, our deferred tax valuation allowances were adjusted primarily for current year movement in deferred taxes and expiration
of carryforwards.
We have a total deferred tax asset valuation allowance of approximately $226 million against gross deferred tax assets of
approximately $3.6 billion as of December 31, 2014, compared to total deferred tax asset valuation allowance of approximately
$200 million against net deferred tax assets of approximately $3.7 billion as of December 31, 2013.