Motorola 2014 Annual Report Download - page 34
Download and view the complete annual report
Please find page 34 of the 2014 Motorola annual report below. You can navigate through the pages in the report by either clicking on the pages listed below, or by using the keyword search tool below to find specific information within the annual report.-
 1
1 -
2
-
3
-
4
-
5
-
6
-
7
-
8
-
9
-
10
-
11
-
12
-
13
-
14
-
15
-
16
-
17
-
18
-
19
-
20
-
21
-
22
-
23
-
 24
24 -
 25
25 -
 26
26 -
 27
27 -
 28
28 -
 29
29 -
 30
30 -
 31
31 -
 32
32 -
 33
33 -
 34
34 -
 35
35 -
 36
36 -
 37
37 -
 38
38 -
 39
39 -
 40
40 -
 41
41 -
 42
42 -
 43
43 -
 44
44 -
45
-
46
-
47
-
48
-
49
-
50
-
51
-
52
-
53
-
54
-
55
-
56
-
57
-
58
-
59
-
60
-
61
-
62
-
63
-
64
-
65
-
66
-
67
-
68
-
69
-
70
-
71
-
72
-
73
-
74
-
75
-
76
-
77
-
78
-
79
-
80
-
81
-
82
-
83
-
84
-
85
-
86
-
87
-
88
-
89
-
90
-
91
-
92
-
93
-
94
-
95
-
96
-
97
-
98
-
99
-
100
-
101
-
102
-
103
-
104
 |
 |

32
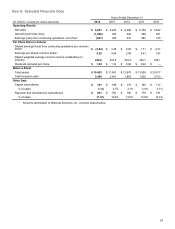
reflected increased order activity and faster-than-expected conversion of certain orders. The segment’s backlog was $1.2 billion
at December 31, 2014 and $1.1 billion at December 31, 2013.
The segment had an operating loss of $667 million in 2014, compared to operating earnings of $639 million in 2013 driven
by an allocation of $1.3 billion of expense related to the settlement of a U.S pension plan. As a percentage of net sales in 2014
compared to 2013, gross margin decreased, SG&A expenditures decreased, R&D expenditures decreased, and Other charges
increased. The decrease in operating earnings was primarily driven by: (i) an increase in Other charges, reflecting $1.3 billion of
allocated charges related to the settlement of a U.S. pension plan and (ii) a decrease in net sales, resulting in lower gross
margin, partially offset by lower SG&A and R&D expenditures as a result of cost savings actions taken and lower variable
compensation expenses.
Segment Results—2013 Compared to 2012
In 2013, the segment’s net sales were $4.1 billion, a 3% decrease compared to 2012 reflecting a decrease in: (i) devices
sales in North America and APME, partially offset by an increase in devices sales within EA and Latin America and (ii) system
sales in Latin America and APME, partially offset by an increase within North America and EA. On a geographic basis, net sales
declined in North America, Latin America and APME, and increased in EA in 2013 compared to 2012. The segment’s backlog
was $1.1 billion at December 31, 2013 and $1.6 billion at December 31, 2012.
The segment had operating earnings of $639 million in 2013, compared to operating earnings of $656 million in 2012. As a
percentage of net sales in 2013 as compared to 2012, gross margin was down slightly, SG&A, and R&D expenditures
decreased. The decrease in operating earnings was primarily due to an increase in Other charges as a result of increased
reorganization of business charges in 2013 as compared to 2012, partially offset by a decrease in SG&A expenses as a result of
lower variable compensation expenses and reduced defined benefit plan expenses.
Services Segment
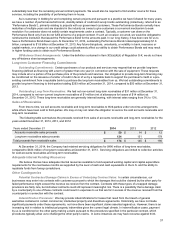
In 2014, the Services segment’s net sales represented 35% of our consolidated net sales, compared to 34% in 2013 and
32% in 2012.
Years ended December 31 Percent Change
(Dollars in millions) 2014 2013 2012 2014—2013 2013—2012
Segment net sales $ 2,074 $ 2,118 $ 2,033 (2)% 4%
Operating earnings (loss) (339) 308 264 (210)% 17%
Segment Results—2014 Compared to 2013
In 2014, the segment’s net sales were $2.1 billion, a 2% decrease compared to 2013 reflecting a decrease in sales of: (i)
iDEN services in North America and Latin America and (iii) Lifecycle Support services in APME and EA, partially offset by an
increase in Managed services sales in APME and EA. On a geographic basis, net sales for 2014 declined in North America and
APME, increased in EA, and remained relatively constant in Latin America, compared to 2013. Overall, Integration services
remained flat due to the timing of certain projects in 2014, as compared to 2013. Lifecycle Support services decreased slightly;
however, demand increased in the fourth quarter of 2014 for our software maintenance and hardware upgrade offerings.
Managed services grew modestly as increasing complexity and the need for enhanced capabilities to support software-centric,
information technology-based networks continued to drive demand in all regions. The segment’s backlog was $4.6 billion at
December 31, 2014, compared to $4.3 billion at December 31, 2013.
The segment had an operating loss of $339 million in 2014, compared to operating earnings of $308 million in 2013. As a
percentage of net sales in 2014 as compared to 2013, gross margin, SG&A expenditures, and R&D expenditures decreased,
and Other charges increased. The decrease in operating earnings was primarily driven by: (i) an increase in Other charges,
reflecting $584 million of allocated charges related to the settlement of a U.S. pension plan and (ii) a decrease in net sales,
resulting in lower gross margin, partially offset by lower SG&A and R&D expenditures as a result of cost savings actions taken
and lower variable compensation expenses.
Segment Results—2013 Compared to 2012
In 2013, the segment’s net sales were $2.1 billion, a 4% increase compared to 2012 reflecting an increase in sales of: (i)
Integration services in North America and EA, and (ii) Lifecycle Support services in North America, partially offset by a decrease
in sales of Managed services in APME. On a geographic basis, net sales for 2013 increased in North America, EA and Latin
America and decreased in APME, compared to 2012. The segment’s backlog was $4.3 billion at December 31, 2013, compared
to $3.4 billion at December 31, 2012.
The segment had operating earnings of $308 million in 2013, compared to operating earnings of $264 million in 2012. As
a percentage of net sales in 2013 as compared to 2012, gross margin was slightly higher and SG&A and R&D expenditures
decreased. The increase in operating earnings was primarily due to: (i) an increase in gross margin as a result of higher margin
from Integration services and (ii) decreases in SG&A expenses as a result of lower variable compensation expenses and
reduced defined benefit plan expenses, partially offset by higher Other charges as a result of higher reorganization of business
charges.