Motorola 2014 Annual Report Download - page 30
Download and view the complete annual report
Please find page 30 of the 2014 Motorola annual report below. You can navigate through the pages in the report by either clicking on the pages listed below, or by using the keyword search tool below to find specific information within the annual report.-
 1
1 -
2
-
3
-
4
-
5
-
6
-
7
-
8
-
9
-
10
-
11
-
12
-
13
-
14
-
15
-
16
-
17
-
18
-
19
-
 20
20 -
 21
21 -
 22
22 -
 23
23 -
 24
24 -
 25
25 -
 26
26 -
 27
27 -
 28
28 -
 29
29 -
 30
30 -
 31
31 -
 32
32 -
 33
33 -
 34
34 -
 35
35 -
 36
36 -
 37
37 -
 38
38 -
 39
39 -
 40
40 -
41
-
42
-
43
-
44
-
45
-
46
-
47
-
48
-
49
-
50
-
51
-
52
-
53
-
54
-
55
-
56
-
57
-
58
-
59
-
60
-
61
-
62
-
63
-
64
-
65
-
66
-
67
-
68
-
69
-
70
-
71
-
72
-
73
-
74
-
75
-
76
-
77
-
78
-
79
-
80
-
81
-
82
-
83
-
84
-
85
-
86
-
87
-
88
-
89
-
90
-
91
-
92
-
93
-
94
-
95
-
96
-
97
-
98
-
99
-
100
-
101
-
102
-
103
-
104
 |
 |
28
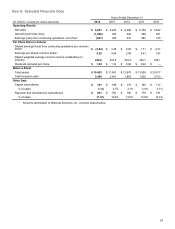
Results of Operations
Years ended December 31
(Dollars in millions, except per share amounts) 2014 % of
Sales ** 2013 % of
Sales ** 2012 % of
Sales **
Net sales from products $ 3,807 $ 4,109 $ 4,236
Net sales from services 2,074 2,118 2,033
Net sales 5,881 6,227 6,269
Costs of product sales 1,678 44.1 % 1,808 44.0 % 1,795 42.4 %
Costs of services sales 1,372 66.2 % 1,310 61.9 % 1,280 63.0 %
Costs of sales 3,050 51.9 % 3,118 50.1 % 3,075 49.1 %
Gross margin 2,831 48.1 % 3,109 49.9 % 3,194 50.9 %
Selling, general and administrative expenses 1,184 20.1 % 1,330 21.4 % 1,472 23.5 %
Research and development expenditures 681 11.6 % 761 12.2 % 790 12.6 %
Other charges 1,972 33.5 % 71 1.1 % 12 0.2 %
Operating earnings (loss) (1,006) (17.1)% 947 15.2 % 920 14.7 %
Other income (expense):
Interest expense, net (126) (2.1)% (113) (1.8)% (66) (1.1)%
Gains on sales of investments 5 0.1 % 37 0.6 % 26 0.4 %
Other (34) (0.6)% 9 0.1 % 1 — %
Total other expense (155) (2.6)% (67) (1.1)% (39) (0.6)%
Earnings (loss) from continuing operations before
income taxes (1,161) (19.7)% 880 14.1 % 881 14.1 %
Income tax expense (benefit) (465) (7.9)% (59) (0.9)% 211 3.4 %
Earnings (loss) from continuing operations (696) (11.8)% 939 15.1 % 670 10.7 %
Less: Earnings attributable to noncontrolling
interests 1 — % 6 0.1 % — — %
Earnings (loss) from continuing operations* (697) (11.9)% 933 15.0 % 670 10.7 %
Earnings from discontinued operations, net of tax 1,996 33.9 % 166 2.7 % 211 3.4 %
Net earnings* $ 1,299 22.1 % $ 1,099 17.6 % $ 881 14.1 %
Earnings (loss) per diluted common share*:
Continuing operations $ (2.84) $ 3.45 $ 2.25
Discontinued operations 8.13 0.61 0.71
Earnings per diluted common share* $ 5.29 $ 4.06 $ 2.96
* Amounts attributable to Motorola Solutions, Inc. common shareholders.
** Percentages may not add due to rounding.
Geographic Market Sales by Locale of End Customer
2014 2013 2012
North America 61% 63% 62%
Latin America 9% 8% 9%
EA 17% 16% 14%
APME 13% 13% 15%
100% 100% 100%
Results of Operations—2014 Compared to 2013
Net Sales
Net sales were $5.9 billion in 2014, down $346 million, or 6%, compared to $6.2 billion in 2013. The decrease in net sales
reflects a $302 million, or 7%, decrease in the Products segment driven by declines in: (i) North America and APME, reflecting
lower devices and systems sales and (ii) Latin America, reflecting lower devices sales, partially offset by single-digit growth in EA