Motorola 2014 Annual Report Download - page 32
Download and view the complete annual report
Please find page 32 of the 2014 Motorola annual report below. You can navigate through the pages in the report by either clicking on the pages listed below, or by using the keyword search tool below to find specific information within the annual report.-
 1
1 -
2
-
3
-
4
-
5
-
6
-
7
-
8
-
9
-
10
-
11
-
12
-
13
-
14
-
15
-
16
-
17
-
18
-
19
-
20
-
21
-
 22
22 -
 23
23 -
 24
24 -
 25
25 -
 26
26 -
 27
27 -
 28
28 -
 29
29 -
 30
30 -
 31
31 -
 32
32 -
 33
33 -
 34
34 -
 35
35 -
 36
36 -
 37
37 -
 38
38 -
 39
39 -
 40
40 -
 41
41 -
 42
42 -
43
-
44
-
45
-
46
-
47
-
48
-
49
-
50
-
51
-
52
-
53
-
54
-
55
-
56
-
57
-
58
-
59
-
60
-
61
-
62
-
63
-
64
-
65
-
66
-
67
-
68
-
69
-
70
-
71
-
72
-
73
-
74
-
75
-
76
-
77
-
78
-
79
-
80
-
81
-
82
-
83
-
84
-
85
-
86
-
87
-
88
-
89
-
90
-
91
-
92
-
93
-
94
-
95
-
96
-
97
-
98
-
99
-
100
-
101
-
102
-
103
-
104
 |
 |
30
Our effective tax rate will change from period to period based on non-recurring events, such as the settlement of income
tax audits, changes in valuation allowances and the tax impact of significant unusual or extraordinary items, as well as recurring
factors including changes in the geographic mix of income and effects of various global income tax strategies.
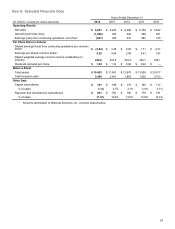
Earnings (Loss) from Continuing Operations Attributable to Motorola Solutions, Inc.
We had a net loss from continuing operations attributable to Motorola Solutions, Inc. of $697 million, or $2.84 per diluted
share, in 2014, compared to net earnings from continuing operations attributable to Motorola Solutions, Inc. of $933 million, or
$3.45 per diluted share, in 2013.
The decrease in net earnings (loss) from continuing operations attributable to Motorola Solutions, Inc. in 2014, as
compared to 2013, was primarily driven by: (i) a $1.9 billion charge related to the settlement of a U.S. pension plan and (ii) a
$278 million decrease in gross margin primarily due to sales declines and a change in sales mix, partially offset by: (i) a $146
million decrease in SG&A and (ii) an $80 million decrease in R&D. The decrease in earnings (loss) per diluted share from
continuing operations was driven by lower net earnings, partially offset by a reduction in shares outstanding as a result of our
share repurchase program.
Earnings from Discontinued Operations
In 2014, we had $2.0 billion in earnings from discontinued operations, net of tax, or $8.13 per diluted share, compared to
$166 million of earnings from discontinued operations, net of tax, or $0.61 per diluted share, in 2013. The earnings from
discontinued operations in both 2014 and 2013 were related to the Enterprise business. The increase in 2014, as compared to
2013 is primarily related to the gain from the sale of the Enterprise business of $1.9 billion.
Results of Operations—2013 Compared to 2012
Net Sales
Net sales were $6.2 billion in 2013 compared to $6.3 billion in 2012. The slight decrease in net sales reflects a $127 million,
or 3%, decrease in the Products segment driven by declines in: (i) North America, reflecting lower devices sales, (ii) APME, as a
result of lower devices and systems sales, and (iii) Latin America, reflecting lower Systems sales, partially offset by double-digit
growth in EA as a result of higher systems sales. The decrease in net sales was offset by an $85 million, or 4%, increase in net
sales relating to the Services segment driven by increases in: (i) North America, as a result of higher net sales in Lifecycle
Support services and Integration services and (ii) EA, reflecting higher Integration services sales, partially offset by a decline in
APME as a result of lower Integration and Managed services sales.
Gross Margin
Gross margin was $3.1 billion, or 49.9% of net sales in 2013, compared to $3.2 billion, or 50.9% of net sales, in 2012. The
decrease in gross margin percentage is driven primarily by: (i) a decline in gross margin as a percentage of sales in North
America, as a result of sales mix between the Products and Services segments, (ii) a decline in gross margin as a percentage of
sales in APME, relating to lower gross margin as a percentage of sales in devices and systems, and (iii) a decline in gross
margin as a percentage of sales in EA, as a result of lower gross margin as a percentage of sales in Integration services.
Selling, General and Administrative Expenses
SG&A expenses decreased 10% to $1.3 billion, or 21.4% of net sales in 2013, compared to $1.5 billion, or 23.5% of net
sales in 2012. The decrease in SG&A is primarily driven by: (i) a number of structural cost improvements, including defined
benefit expenses, and (ii) decreases in variable compensation expenses.
Research and Development Expenditures
R&D expenditures decreased 4% to $761 million, or 12.2% of net sales in 2013, compared to $790 million, or 12.6% of net
sales in 2012. The decrease in R&D expenditures is primarily due to: (i) reduced compensation expenses and (ii) reduced
spending in certain development programs, such as iDEN.
Other Charges
We recorded net charges of $71 million in Other charges in 2013, compared to net charges of $12 million in 2012. The
charges in 2013 included: (i) $70 million of net reorganization of business charges and (ii) $1 million of charges relating to
amortization of intangibles. The charges in 2012 included: (i) $27 million of charges relating to reorganization of business
charges and (ii) $1 million of charges relating to amortization of intangibles, partially offset by $16 million of income related to a
legal matter. The net reorganization of business charges are discussed in further detail in the “Reorganization of Businesses”
section.
Net Interest Expense
Net interest expense was $113 million in 2013, compared to net interest expense of $66 million in 2012. Net interest
expense in 2013 included interest expense of $132 million, partially offset by interest income of $19 million. Net interest expense
in 2012 included interest expense of $108 million, partially offset by interest income of $42 million. The increase in net interest
expense in 2013 compared to 2012 is primarily attributable to: (i) higher interest expense driven by an increase in average debt
outstanding and $5 million of income tax-related interest charges and (ii) a decrease in interest income due to lower average
cash and cash equivalents during 2013 compared to 2012.