Motorola 2014 Annual Report Download - page 31
Download and view the complete annual report
Please find page 31 of the 2014 Motorola annual report below. You can navigate through the pages in the report by either clicking on the pages listed below, or by using the keyword search tool below to find specific information within the annual report.-
 1
1 -
2
-
3
-
4
-
5
-
6
-
7
-
8
-
9
-
10
-
11
-
12
-
13
-
14
-
15
-
16
-
17
-
18
-
19
-
20
-
 21
21 -
 22
22 -
 23
23 -
 24
24 -
 25
25 -
 26
26 -
 27
27 -
 28
28 -
 29
29 -
 30
30 -
 31
31 -
 32
32 -
 33
33 -
 34
34 -
 35
35 -
 36
36 -
 37
37 -
 38
38 -
 39
39 -
 40
40 -
 41
41 -
42
-
43
-
44
-
45
-
46
-
47
-
48
-
49
-
50
-
51
-
52
-
53
-
54
-
55
-
56
-
57
-
58
-
59
-
60
-
61
-
62
-
63
-
64
-
65
-
66
-
67
-
68
-
69
-
70
-
71
-
72
-
73
-
74
-
75
-
76
-
77
-
78
-
79
-
80
-
81
-
82
-
83
-
84
-
85
-
86
-
87
-
88
-
89
-
90
-
91
-
92
-
93
-
94
-
95
-
96
-
97
-
98
-
99
-
100
-
101
-
102
-
103
-
104
 |
 |
29
as a result of higher devices sales. In addition, the decrease in net sales includes a $44 million, or 2%, decrease in net sales
relating to the Services segment driven by declines in: (i) North America, as a result of declines in iDEN services and integration
services, (ii) APME, reflecting lower sales in Lifecycle Support services and Integration services, and (iii) Latin America,
reflecting a decrease in iDEN services, partially offset by an increase in EA, as a result of increased Integration and Managed
services sales. Sales in 2014 were positively impacted in the fourth quarter by increased order activity and faster-than-expected
conversion of certain orders.
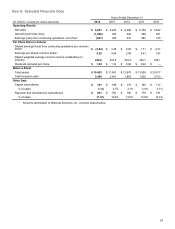
Gross Margin
Gross margin was $2.8 billion, or 48.1% of net sales in 2014, compared to $3.1 billion, or 49.9% of net sales, in 2013. The
decrease in gross margin percentage is driven primarily by: (i) a decline in gross margin as a percentage of sales in North
America and Latin America, as a result of lower net sales in iDEN services which have a slightly higher gross margin percentage
compared to the rest of the Services portfolio and (ii) a decline in gross margin as a percentage of sales in EA, as a result of the
mix of projects in the field.
Selling, General and Administrative Expenses
Selling, general and administrative (“SG&A”) expenses decreased 11% to $1.2 billion, or 20.1% of net sales in 2014,
compared to $1.3 billion, or 21.4% of net sales in 2013. The decrease in SG&A expenditures is primarily due to: (i) the reduction
of sales support costs by lowering our overall non-quota carrying employee base, (ii) lower pension expenses, (iii) lower
incentive compensation expenses, and (iv) reduced costs through the increased use of centralized services.
Research and Development Expenditures
R&D expenditures decreased 11% to $681 million, or 11.6% of net sales in 2014, compared to $761 million, or 12.2% of
net sales in 2013. The decrease in R&D expenditures is primarily due to: (i) headcount reductions enacted during previous
periods, (ii) lower incentive compensation expenses, (iii) the consolidation of testing processes and lab sites, and (iv) the
movement of employees to lower cost work sites.
Other Charges
We recorded net charges of $2.0 billion in Other charges in 2014, compared to net charges of $71 million in 2013. The
charges in 2014 included: (i) a $1.9 billion charge related to the settlement of a U.S. pension plan, (ii) $64 million of net
reorganization of business charges, and (iii) $8 million of legal settlement charges, partially offset by a $21 million gain on the
sale of a building and land. The charges in 2013 included $70 million of charges related to the reorganization of business. The
net reorganization of business charges and the settlement of a U.S. pension plan are discussed in further detail in the
“Reorganization of Businesses” and "Liquidity and Capital Resources" sections, respectively.
Net Interest Expense
Net interest expense was $126 million in 2014, compared to net interest expense of $113 million in 2013. Net interest
expense in 2014 included interest expense of $147 million, partially offset by interest income of $21 million. Net interest expense
in 2013 included interest expense of $132 million, partially offset by interest income of $19 million. The increase in interest
expense in 2014 compared to 2013 is primarily attributable to an increase in average debt outstanding during 2014 compared to
2013.
Gains on Sales of Investments
Gains on sales of investments were $5 million in 2014, compared to $37 million in 2013. These gains consist of gains on the
sale of multiple equity investments in both 2014 and 2013.
Other
Net Other expense was $34 million in 2014, compared to net Other income of $9 million in 2013. The net Other expense in
2014 was primarily comprised of: (i) a $37 million loss on the extinguishment of debt, (ii) a $7 million foreign currency loss, and
(iii) $6 million of other non-operating losses, partially offset by $16 million of equity method investment earnings. Net Other
income in 2013 was primarily comprised of: (i) $11 million of other non-operating gains and (ii) $10 million of equity method
investment earnings, partially offset by: (i) a $9 million foreign currency loss and (ii) investment impairments of $3 million.
Effective Tax Rate
We recorded a $465 million net tax benefit, resulting in a 40% effective tax rate, in 2014 on our pre-tax loss compared to
$59 million of net tax benefit, resulting in an effective tax rate of negative 7%, in 2013. Our effective tax rate in 2014 was
favorably impacted by: (i) state tax benefits on the pension settlement loss, (ii) $29 million in tax benefits associated with the net
reduction in unrecognized tax benefits and (iii) $19 million in net reduction in our deferred tax liability for undistributed foreign
earnings primarily due to changes in permanent reinvestment assertions. These benefits were partially offset by tax expense for
the establishment of a $55 million valuation allowance on certain foreign deferred tax assets.
Our negative effective tax rate in 2013 was lower than the U.S. statutory tax rate of 35% due to: (i) $337 million associated
with excess foreign tax credits on undistributed foreign earnings, (ii) a $25 million reduction in our deferred tax liability for
undistributed foreign earnings primarily due to changes in permanent reinvestment assertions, and (iii) a $9 million tax benefit for
R&D tax credits.