Motorola 2014 Annual Report Download - page 36
Download and view the complete annual report
Please find page 36 of the 2014 Motorola annual report below. You can navigate through the pages in the report by either clicking on the pages listed below, or by using the keyword search tool below to find specific information within the annual report.-
 1
1 -
2
-
3
-
4
-
5
-
6
-
7
-
8
-
9
-
10
-
11
-
12
-
13
-
14
-
15
-
16
-
17
-
18
-
19
-
20
-
21
-
22
-
23
-
24
-
25
-
 26
26 -
 27
27 -
 28
28 -
 29
29 -
 30
30 -
 31
31 -
 32
32 -
 33
33 -
 34
34 -
 35
35 -
 36
36 -
 37
37 -
 38
38 -
 39
39 -
 40
40 -
 41
41 -
 42
42 -
 43
43 -
 44
44 -
 45
45 -
 46
46 -
47
-
48
-
49
-
50
-
51
-
52
-
53
-
54
-
55
-
56
-
57
-
58
-
59
-
60
-
61
-
62
-
63
-
64
-
65
-
66
-
67
-
68
-
69
-
70
-
71
-
72
-
73
-
74
-
75
-
76
-
77
-
78
-
79
-
80
-
81
-
82
-
83
-
84
-
85
-
86
-
87
-
88
-
89
-
90
-
91
-
92
-
93
-
94
-
95
-
96
-
97
-
98
-
99
-
100
-
101
-
102
-
103
-
104
 |
 |
34
repatriation of some of these funds may be subject to delay for local country approvals and could have potential adverse cash
tax consequences.
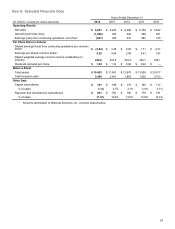
Operating Activities
Cash used for operating activities from continuing operations in 2014 was $685 million, compared to cash provided by
operating activities from continuing operations of $555 million in 2013 and $674 million in 2012. Operating cash flows in 2014, as
compared to 2013, were negatively impacted by contributions to our pension plans of $1.3 billion, an increase of $1.1 billion
compared to 2013, primarily related to a U.S. pension plan settlement. Operating cash flows in 2013, as compared to 2012, were
negatively impacted by: (i) higher cash tax payments, including Indian tax deposits of $43 million, and (ii) lower collections and
sales of long-term receivables, including receivables related to the Networks divestiture that were retained after the sale and
sold or collected in 2012, partially offset by approximately $190 million of lower defined benefit plan contributions in 2012 as
compared to 2013.
In September 2014, we entered into a Definitive Purchase Agreement (“the Agreement”) by and among Motorola Solutions,
The Prudential Insurance Company of America (“PICA”), Prudential Financial, Inc. and State Street Bank and Trust Company, as
Independent Fiduciary of one of our U.S. Pension Plans (the “Regular Pension Plan”, as defined in Note 7 to our consolidated
financial statements). Under the Agreement, the Regular Pension Plan planned to purchase from PICA a group annuity contract
that requires PICA to pay and administer certain future annuity payments to approximately 30,000 of our retirees. In anticipation
of the Agreement, we established a new pension plan with substantially the same terms as the Regular Pension Plan (the “New
Plan") to accommodate our remaining active employees and non-retirees. On December 3, 2014, the Regular Pension Plan
closed its planned purchase of a group annuity from PICA. The total premium paid by the Regular Pension Plan to PICA was
the transfer of approximately $3.2 billion in plan assets, and is subject to customary post-closing true-ups. The Regular Pension
Plan was then terminated.
Also in September 2014, we announced that the New Plan was offering a maximum of $1.0 billion of lump-sum
distributions to certain participants who had accrued a pension benefit, had left the Company prior to June 30, 2014, and had not
yet started receiving pension benefit payments (“the Eligible Participants”). The aggregate amount of lump-sum elections
accepted by Eligible Participants exceeded the maximum of $1.0 billion, and $1.0 billion was paid from plan assets in December
2014.
We contributed $1.1 billion, $150 million, and $340 million to our U.S. pension plans during 2014, 2013, and 2012,
respectively. In addition, we contributed $237 million, $32 million, and $31 million to our Non-U.S. Pension Plans during 2014,
2013, and 2012, respectively. We expect to make no cash contributions to our U.S. Pension Benefit Plans and approximately
$12 million to our Non-U.S. Pension Benefit Plans in 2015.
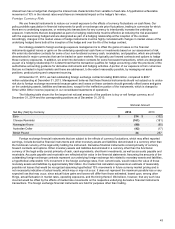
Investing Activities
Net cash provided by investing activities from continuing operations was $3.2 billion in 2014, compared to $2.0 billion in
2013 and $1.0 billion in 2012. The $1.2 billion increase in net cash provided by investing activities from 2013 to 2014 was
primarily due to a $3.3 billion increase of proceeds from sales of investments and businesses, related to the sale of our
Enterprise business, partially offset by a $2.1 billion decrease in proceeds from sales of Sigma Fund investments, which we
exited in the fourth quarter of 2013. The $1.1 billion increase in net cash provided by investing activities from 2012 to 2013 was
primarily due to a $1.1 billion increase in proceeds from net sales of Sigma Fund investments.
Sigma Fund: Prior to December 2013, we invested most of our U.S. dollar-denominated cash in a fund (the “Sigma
Fund”) that was managed by independent investment management firms under specific investment guidelines restricting the
type of investments held and their time to maturity. In December 2013, we completed the liquidation of the Sigma Fund and
migrated the international U.S dollar-denominated cash to a U.S. dollar cash pool invested primarily in U.S. dollar prime money
market funds. The creation of the international cash pool enhances our flexibility to repatriate excess overseas cash and fund
global operations. These money market funds are classified as Cash and cash equivalents within the consolidated balance
sheets as of December 31, 2014 and 2013. We had net proceeds of $2.1 billion in 2013 compared to $1.1 billion in net proceeds
of Sigma Fund investments in 2012.
Acquisitions and Investments: We used cash of $47 million for acquisitions and new investment activities in 2014,
compared to $57 million in 2013 and receiving cash of $83 million in 2012. The cash used in 2014 was for the acquisition of an
equipment provider for $22 million and a number of equity investments. The cash used in 2013 was for the acquisition of a
communications software provider in push-to-talk-over-broadband applications for a purchase price, net of cash acquired, of $36
million, and other small strategic equity investments. The cash received in 2012 was primarily for the agreement with Nokia
Siemens Networks ("NSN") to take over responsibility to implement Norway´s TETRA public safety network, offset by other small
strategic investments.
In accordance with the Acquisition Agreement, the sale of our Enterprise business is subject to certain customary purchase
price adjustments. Among those adjustments for which we expect reimbursement is the refund of $49 million of cash from Zebra
for legal entities that had cash balances which were effected through a stock sale. The $49 million, and other purchase price
adjustments, are expected to be settled in 2015.
Capital Expenditures: Capital expenditures were $181 million in 2014, compared to $169 million in 2013, and $170
million in 2012. Capital spending in 2014, 2013, and 2012 was primarily comprised of: (i) updates to our information technology
infrastructure, (ii) network build out expenditures related to our Services segment and (iii) facility renovations. The increase in