Mazda 2013 Annual Report Download - page 56
Download and view the complete annual report
Please find page 56 of the 2013 Mazda annual report below. You can navigate through the pages in the report by either clicking on the pages listed below, or by using the keyword search tool below to find specific information within the annual report.-
 1
1 -
2
-
3
-
4
-
5
-
6
-
7
-
8
-
9
-
10
-
11
-
12
-
13
-
14
-
15
-
16
-
17
-
18
-
19
-
20
-
21
-
22
-
23
-
24
-
25
-
26
-
27
-
28
-
29
-
30
-
31
-
32
-
33
-
34
-
35
-
36
-
37
-
38
-
39
-
40
-
41
-
42
-
43
-
44
-
45
-
 46
46 -
 47
47 -
 48
48 -
 49
49 -
 50
50 -
 51
51 -
 52
52 -
 53
53 -
 54
54 -
 55
55 -
 56
56 -
 57
57 -
 58
58 -
 59
59 -
 60
60
 |
 |

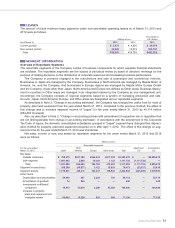
Thousands of U.S. dollars
Reportable segments
Adjustment
(*1)
Consolidated
(*2)
For the year ended
March 31, 2013 Japan
North
America Europe Other areas Total
Net sales:
Outside customers $ 8,467,223 $6,887,043 $3,664,191 $4,441,862 $23,460,319 $ — $23,460,319
Inter-segment 11,677,266 27,638 110,085 11,947 11,826,936 (11,826,936) —
Total 20,144,489 6,914,681 3,774,276 4,453,809 35,287,255 (11,826,936) 23,460,319
Segment income/(loss) 1,153,074 (519,968) 33,213 179,138 845,457 (271,670) 573,787
Segment assets 18,891,819 3,289,479 1,723,904 1,878,117 25,783,319 (4,734,734) 21,048,585
Other items:
Depreciation and amortization 594,670 9,011 23,617 7,957 635,255 — 635,255
Amortization of goodwill 149 2,404 — — 2,553 — 2,553
Investmentsinafliated
companies 165,670 379,096 24,255 591,043 1,160,064 — 1,160,064
In crease in property,
plant and equipment and
intangible assets 596,202 207,660 6,734 10,574 821,170 — 821,170
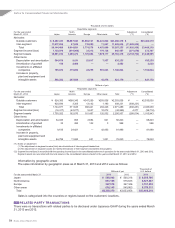
Millions of yen
Reportable segments
Adjustment
(*1)
Consolidated
(*2)
For the year ended
March 31, 2012 Japan
North
America Europe Other areas Total
Net sales:
Outside customers ¥ 824,383 ¥568,340 ¥347,299 ¥293,036 ¥2,033,058 ¥ — ¥2,033,058
Inter-segment 920,594 3,305 13,142 1,190 938,231 (938,231) —
Total 1,744,977 571,645 360,441 294,226 2,971,289 (938,231) 2,033,058
Segment income/(loss) (18,417) (40,277) 5,627 10,072 (42,995) 4,277 (38,718)
Segment assets 1,750,262 162,676 161,487 126,532 2,200,957 (285,014) 1,915,943
Other items:
Depreciation and amortization 64,035 863 2,684 621 68,203 — 68,203
Amortization of goodwill 33 450 102 3 588 — 588
Investmentsinafliated
companies 9,615 29,421 — 42,953 81,989 — 81,989
In crease in property,
plant and equipment and
intangible assets 64,758 11,660 621 1,001 78,040 — 78,040
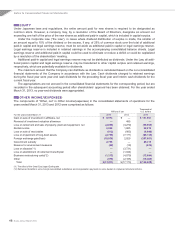
(*1) Notes on adjustment:
(1) The adjustment on segment income/(loss) are eliminations of inter-segment transactions.
(2) The adjustment on segment assets are mainly eliminations of inter-segment receivables and payables.
(*2) Segment income/(loss) is reconciled with the operating income/(loss) in the consolidated statement of operations for the years ended March 31, 2013 and 2012.
Segment assets are reconciled with the total assets in the consolidated balance sheets for the years ended March 31, 2013 and 2012.
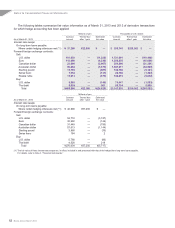
Information by geographic areas
The sales information by geographic areas as of March 31, 2013 and 2012 were as follows:
Millions of yen
Thousands of
U.S. dollars
For the years ended March 31 2013 2012 2013
Japan ¥ 588,042 ¥ 560,216 $ 6,255,766
North America 651,165 575,633 6,927,287
Europe 347,918 347,346 3,701,255
Other areas 618,145 549,863 6,576,011
Total ¥2,205,270 ¥2,033,058 $23,460,319
Sales is categorized into the countries or regions based on the customers’ locations.
18 RELATED PARTY TRANSACTIONS
There were no transactions with related parties to be disclosed under Japanese GAAP during the years ended March
31, 2013 and 2012.
Notes to Consolidated Financial Statements
Mazda Annual Report 2013
54