Mazda 2013 Annual Report Download - page 36
Download and view the complete annual report
Please find page 36 of the 2013 Mazda annual report below. You can navigate through the pages in the report by either clicking on the pages listed below, or by using the keyword search tool below to find specific information within the annual report.-
 1
1 -
2
-
3
-
4
-
5
-
6
-
7
-
8
-
9
-
10
-
11
-
12
-
13
-
14
-
15
-
16
-
17
-
18
-
19
-
20
-
21
-
22
-
23
-
24
-
25
-
 26
26 -
 27
27 -
 28
28 -
 29
29 -
 30
30 -
 31
31 -
 32
32 -
 33
33 -
 34
34 -
 35
35 -
 36
36 -
 37
37 -
 38
38 -
 39
39 -
 40
40 -
 41
41 -
 42
42 -
 43
43 -
 44
44 -
 45
45 -
 46
46 -
47
-
48
-
49
-
50
-
51
-
52
-
53
-
54
-
55
-
56
-
57
-
58
-
59
-
60
 |
 |

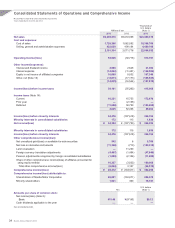
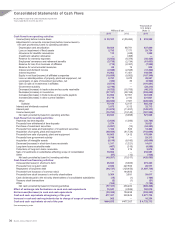
Consolidated Statements of Operations and Comprehensive Income
Mazda Motor Corporation and Consolidated Subsidiaries
Years ended March 31, 2013 and 201 2
Millions of yen
Thousands of
U.S. dollars
(Note 1)
2013 2012 2013
Net sales ¥2,205,270 ¥2,033,058 $23,460,319
Cost and expenses:
Cost of sales 1,729,296 1,662,592 18,396,766
Selling, general and administrative expenses 422,038 409,184 4,489,766
2,151,334 2,071,776 22,886,532
Operating income/(loss) 53,936 (38,718) 573,787
Other income/(expenses):
Interest and dividend income 2,948 2,528 31,362
Interest expense (14,062) (11,451) (149,596)
Equity in net income of affiliated companies 10,090 9,552 107,340
Other, net (Note 13) (13,811) (17,173) (146,925)
(14,835) (16,544) (157,819)
Income/(loss) before income taxes 39,101 (55,262) 415,968
Income taxes (Note 14):
Current 16,231 15,755 172,670
Prior year — (2,158) —
Deferred (11,606) 38,759 (123,468)
4,625 52,356 49,202
Income/(loss) before minority interests 34,476 (107,618) 366,766
Minority interests in consolidated subsidiaries 172 115 1,830
Net income/(loss) ¥ 34,304 ¥ (107,733) $ 364,936
Minority interests in consolidated subsidiaries 172 115 1,830
Income/(loss) before minority interests 34,476 (107,618) 366,766
Other comprehensive income/(loss):
Net unrealized gain/(loss) on available-for-sale securities 542 8 5,766
Net loss on derivative instruments (11,366) (719) (120,915)
Land revaluation — 11,250 —
Foreign currency translation adjustments (4,497) (1,494) (47,840)
Pension adjustments recognized by foreign consolidated subsidiaries (1,080) (2,106) (11,489)
Share of other comprehensive income/(loss) of affiliates accounted for
using equity method 10,337 (3,832) 109,968
Total other comprehensive income/(loss) (6,064) 3,107 (64,510)
Comprehensive income/(loss) ¥ 28,412 ¥ (104,511) $ 302,256
Comprehensive income/(loss) attributable to:
Shareholders of Mazda Motor Corporation 26,891 (104,871) 286,075
Minority shareholders 1,521 360 16,181
Yen
U.S. dollars
(Note 1)
Amounts per share of common stock:
Net income/(loss) (Note 2):
Basic ¥11.48 ¥(57.80) $0.12
Cash dividends applicable to the year — — —
See accompanying notes.
Mazda Annual Report 2013
34