Mazda 2013 Annual Report Download - page 38
Download and view the complete annual report
Please find page 38 of the 2013 Mazda annual report below. You can navigate through the pages in the report by either clicking on the pages listed below, or by using the keyword search tool below to find specific information within the annual report.-
 1
1 -
2
-
3
-
4
-
5
-
6
-
7
-
8
-
9
-
10
-
11
-
12
-
13
-
14
-
15
-
16
-
17
-
18
-
19
-
20
-
21
-
22
-
23
-
24
-
25
-
26
-
27
-
 28
28 -
 29
29 -
 30
30 -
 31
31 -
 32
32 -
 33
33 -
 34
34 -
 35
35 -
 36
36 -
 37
37 -
 38
38 -
 39
39 -
 40
40 -
 41
41 -
 42
42 -
 43
43 -
 44
44 -
 45
45 -
 46
46 -
 47
47 -
 48
48 -
49
-
50
-
51
-
52
-
53
-
54
-
55
-
56
-
57
-
58
-
59
-
60
 |
 |

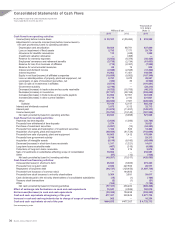
Consolidated Statements of Cash Flows
Mazda Motor Corporation and Consolidated Subsidiaries
Years ended March 31, 2013 and 201 2
Millions of yen
Thousands of
U.S. dollars
(Note 1)
2013 2012 2013
Cash flows from operating activities:
Income/(loss) before income taxes ¥ 39,101 ¥ (55,262) $ 415,968
Adjustments to reconcile income/(loss) before income taxes to
net cash provided by/(used in) operating activities:
Depreciation and amortization 59,954 68,791 637,809
Loss on impairment of fixed assets 2,795 7,171 29,734
Allowance for doubtful receivables 113 (245) 1,202
Investment valuation allowance —(495) —
Reserve for warranty expenses (4,552) (9,378) (48,426)
Employees' severance and retirement benefits (5,739) (2,134) (61,053)
Reserve for loss from business of affiliates (714) (2,327) (7,596)
Reserve for environmental measures 60 19 638
Interest and dividend income (2,948) (2,528) (31,362)
Interest expense 14,062 11,451 149,596
Equity in net loss/(income) of affiliated companies (10,090) (9,552) (107,340)
Loss on sale/disposition of property, plant and equipment, net 2,721 3,270 28,947
Loss/(gain) on sale of investment securities, net (329) 36 (3,500)
Gain on sale of investments in affiliates (9,574) —(101,851)
Government subsidy (2,746) —(29,213)
Decrease/(increase) in trade notes and accounts receivable (4,532) (15,709) (48,213)
Decrease/(increase) in inventories (37,187) (28,185) (395,606)
Increase/(decrease) in trade notes and accounts payable 33,994 37,551 361,638
Increase/(decrease) in other current liabilities 21,716 2,142 231,021
Other (20,686) 7,581 (220,063)
Subtotal 75,419 12,197 802,330
Interest and dividends received 3,075 3,112 32,713
Interest paid (13,678) (11,267) (145,511)
Income taxes paid (15,783) (13,140) (167,904)
Net cash provided by/(used in) operating activities 49,033 (9,098) 521,628
Cash flows from investing activities:
Payments into time deposits (3,644) (1,000) (38,766)
Proceeds from withdrawal of time deposits 3,574 —38,021
Purchase of investment securities (5,097) (12) (54,223)
Proceeds from sales and redemption of investment securities 1,166 600 12,404
Acquisition of property, plant and equipment (69,899) (61,724) (743,606)
Proceeds from sale of property, plant and equipment 16,065 1,412 170,904
Proceeds from government subsidy 2,746 —29,213
Acquisition of intangible assets (6,110) (8,160) (65,000)
Decrease/(increase) in short-term loans receivable 1,317 (1,321) 14,011
Long-term loans receivable made (467) (319) (4,968)
Collections of long-term loans receivable 345 219 3,670
Sale of investments in subsidiaries affecting scope of consolidation 19,804 —210,681
Other (87) (12) (926)
Net cash provided by/(used in) investing activities (40,287) (70,317) (428,585)
Cash flows from financing activities:
Increase/(decrease) in short-term debt 25,683 (9,983) 273,223
Proceeds from long-term debt 2,680 227,550 28,511
Repayment of long-term debt (94,727) (129,450) (1,007,734)
Proceeds from issuance of common stock —144,656 —
Proceeds from stock issuance to minority shareholders 9,364 3,691 99,617
Cash dividends paid to the minority shareholders of consolidated subsidiaries (15) (1) (160)
Treasury stock transactions (2) (1) (21)
Other (164) —(1,744)
Net cash provided by/(used in) financing activities (57,181) 236,462 (608,308)
Effect of exchange rate fluctuations on cash and cash equivalents 15,041 (2,589) 160,010
Net increase/(decrease) in cash and cash equivalents (33,394) 154,458 (355,255)
Cash and cash equivalents at beginning of the year 477,307 322,849 5,077,734
Increase in cash and cash equivalents due to change of scope of consolidation 962 —10,234
Cash and cash equivalents at end of the year ¥444,875 ¥477,307 $ 4,732,713
See accompanying notes.
Mazda Annual Report 2013
36