Mazda 2013 Annual Report Download - page 33
Download and view the complete annual report
Please find page 33 of the 2013 Mazda annual report below. You can navigate through the pages in the report by either clicking on the pages listed below, or by using the keyword search tool below to find specific information within the annual report.-
 1
1 -
2
-
3
-
4
-
5
-
6
-
7
-
8
-
9
-
10
-
11
-
12
-
13
-
14
-
15
-
16
-
17
-
18
-
19
-
20
-
21
-
22
-
 23
23 -
 24
24 -
 25
25 -
 26
26 -
 27
27 -
 28
28 -
 29
29 -
 30
30 -
 31
31 -
 32
32 -
 33
33 -
 34
34 -
 35
35 -
 36
36 -
 37
37 -
 38
38 -
 39
39 -
 40
40 -
 41
41 -
 42
42 -
 43
43 -
44
-
45
-
46
-
47
-
48
-
49
-
50
-
51
-
52
-
53
-
54
-
55
-
56
-
57
-
58
-
59
-
60
 |
 |

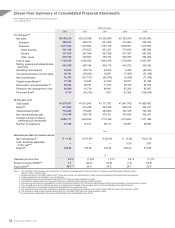
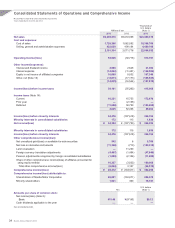
(Net Income)
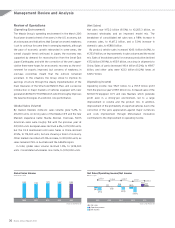
Other income and expenses came to a net expense of ¥14.8
billion, which combined with the increase in operating income
resulted in a ¥94.4 billion increase in income before taxes, to a
¥39.1 billion profit from the previous year’s ¥55.3 billion loss.
Net income increased ¥142.0 billion, to a ¥34.3 billion profit,
from the previous year’s ¥107.7 billion loss. Net income per
share was a positive ¥1 1.48, compared with the previous year’s
¥57.80 loss.
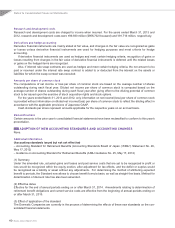
Financial Position
Total assets as of March 31, 2013, were ¥1,978.6 billion, for a
¥62.6 billion increase from the end of the previous fiscal year
on growth in cash and deposits and in inventories. Cash and
cash equivalents decreased ¥32.4 billion, to ¥444.9 billion,
inventories grew ¥49.5 billion, to ¥265.7 billion, and net
property, plant and equipment was basically unchanged at
¥784.4 billion.
Total short- and long-term interest-bearing debt decreased
¥59.1 billion, to ¥719.0 billion. Subtracting the ¥444.9 billion of
cash and cash equivalents as of the fiscal year-end, net interest-
bearing debt decreased ¥26.7 billion, to ¥274.1 billion, and the
net debt-to-equity ratio stood at 55.2%. (45.0% after the
recognition of equity capital attributes of subordinated loans).
Despite the decrease in interest-bearing debt, total liabilities as
of the fiscal year-end increased ¥23.8 billion, to ¥1,465.3 billion,
from an increase in trade notes and accounts payable.
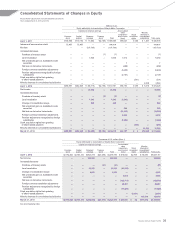
With the improvement in retained earnings from the
recording of profit, total equity increased ¥38.8 billion from
the previous fiscal year-end, to ¥513.2 billion. Equity used for
the calculation of the equity ratio (equity less minority
interests and stock acquisition rights) increased ¥27.5 billion,
to ¥496.3 billion, leading to a 0.6 percentage-point increase in
the equity ratio, to 25.1% (26.9% after the recognition of
equity capital attributes of subordinated loans).
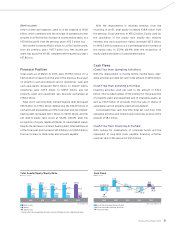
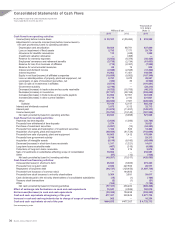
Cash Flows
(Cash Flow from Operating Activities)
With the improvement in income before income taxes, oper-
ating activities provided net cash in the amount of ¥49.0 billion.
(Cash Flow from Investing Activities)
Investing activities used net cash in the amount of ¥40.3
billion. This included outlays of ¥76.0 billion for the acquisition
of property, plant and equipment and of intangible assets, as
well as ¥35.9 billion of proceeds from the sale of shares of
subsidiaries and of property, plant and equipment.
Consolidated free cash flow (the total net cash flow from
operating activities and investing activities) was positive in the
amount of ¥8.7 billion.
(Cash Flow from Financing Activities)
With outlays for redemptions of corporate bonds and the
repayment of long-term loans payable, financing activities
used net cash in the amount of ¥57.2 billion.
1,801.0 1,947.8 1,771.8 1,915.9
414.7 509.8 430.5 474.4
1,978.6
513.2
22.9 26.1 24.2 26.9*
26.3*
2009 2010 2011 2012 2013
Total Assets/Equity/Equity Ratio
Billions of yen/%
(67.4)(61.8)
(44.3) (70.3)
(40.3)
111.6
15.3
(9.1)
49.0
(13.7)
67.4
(129.2)
(79.4)
8.7
1.6
2009 2010 2011 2012 2013
Cash Flows
Billions of yen
Total assets
Equity
Equity ratio
* Ratios after the recognition of equity capital attributes of the subordinated loan.
Cash flow from operating activities
Cash flow from investing activities
Free cash flow
(As of March 31) (Years ended March 31)
Mazda Annual Report 2013 31