Mazda 2013 Annual Report Download - page 45
Download and view the complete annual report
Please find page 45 of the 2013 Mazda annual report below. You can navigate through the pages in the report by either clicking on the pages listed below, or by using the keyword search tool below to find specific information within the annual report.
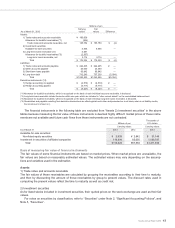
Millions of yen
As of March 31, 2012
Carrying
values
Fair
values Difference
Assets:
1) Trade notes and accounts receivable ¥ 166,008
Allowance for doubtful receivables (*1) (254)
Trade notes and accounts receivable, net 165,754 ¥ 165,750 ¥ (4)
2) Investment securities
Available-for-sale securities 5,466 5,466 —
3) Long-term loans receivable (*2) 5,481
Allowance for doubtful receivables (*3) (2,367)
Long-term loans receivable, net 3,114 3,114 —
Total ¥ 174,334 ¥ 174,330 ¥ (4)
Liabilities:
1) Trade notes and accounts payable ¥ 244,405 ¥ 244,405 ¥ —
2) Other accounts payable 23,040 23,040 —
3) Short-term loans payable 65,842 65,842 —
4) Long-term debt 712,243 707,239 (5,004)
Total ¥1,045,530 ¥1,040,526 ¥(5,004)
Derivative instruments: (*4)
1) Hedge accounting not applied ¥ (2,510) ¥ (2,510) ¥ —
2) Hedge accounting applied (5,717) (5,717) —
Total ¥ (8,227) ¥ (8,227) ¥ —
(*1) Allowance for doubtful receivables, which is recognized on the basis of each individual accounts receivable, is deducted.
(*2) Long-term loans receivable include those due within one year, which are included in “other current assets” on the consolidated balance sheet.
(*3) Allowance for doubtful receivables, which is recognized on the basis of each individual long-term loans receivable, is deducted.
(*4) Receivables and payables resulting from derivative transactions are offset against each other and presented on a net basis; when a net liability results,
the net amount is shown in ().
The financial instruments in the following table are excluded from “Assets 2) Investment securities” in the above
tables because measuring the fair value of these instruments is deemed highly difficult: market prices of these instru-
ments are not available and future cash flows from these instruments are not contracted.
Millions of yen
Thousands of
U.S. dollars
Carrying values Carrying values
As of March 31 2013 2012 2013
Available-for-sale securities:
Non-listed equity securities ¥ 2,928 ¥ 2,842 $ 31,149
Investment in securities of affiliated companies 110,994 85,050 1,180,787
Total ¥113,922 ¥87,892 $1,211,936
Basis of measuring fair value of financial instruments
The fair values of some financial instruments are based on market prices. When market prices are unavailable, the
fair values are based on reasonably estimated values. The estimated values may vary depending on the assump-
tions and variables used in the estimation.
Assets
1) Trade notes and accounts receivable
The fair values of these receivables are calculated by grouping the receivables according to their time to maturity,
and then by discounting the amount of those receivables by group to present values. The discount rates used in
computing the present values reflect the time to maturity as well as credit risk.
2) Investment securities
As for listed stocks included in investment securities, their quoted prices on the stock exchange are used as their fair
values.
For notes on securities by classification, refer to “Securities” under Note 2, “Significant Accounting Policies", and
Note 5, “Securities”.
Mazda Annual Report 2013 43


