Mazda 2013 Annual Report Download - page 4
Download and view the complete annual report
Please find page 4 of the 2013 Mazda annual report below. You can navigate through the pages in the report by either clicking on the pages listed below, or by using the keyword search tool below to find specific information within the annual report.-
 1
1 -
 2
2 -
 3
3 -
 4
4 -
 5
5 -
 6
6 -
 7
7 -
 8
8 -
 9
9 -
 10
10 -
 11
11 -
 12
12 -
 13
13 -
 14
14 -
 15
15 -
16
-
17
-
18
-
19
-
20
-
21
-
22
-
23
-
24
-
25
-
26
-
27
-
28
-
29
-
30
-
31
-
32
-
33
-
34
-
35
-
36
-
37
-
38
-
39
-
40
-
41
-
42
-
43
-
44
-
45
-
46
-
47
-
48
-
49
-
50
-
51
-
52
-
53
-
54
-
55
-
56
-
57
-
58
-
59
-
60
 |
 |
( ) indicates minus
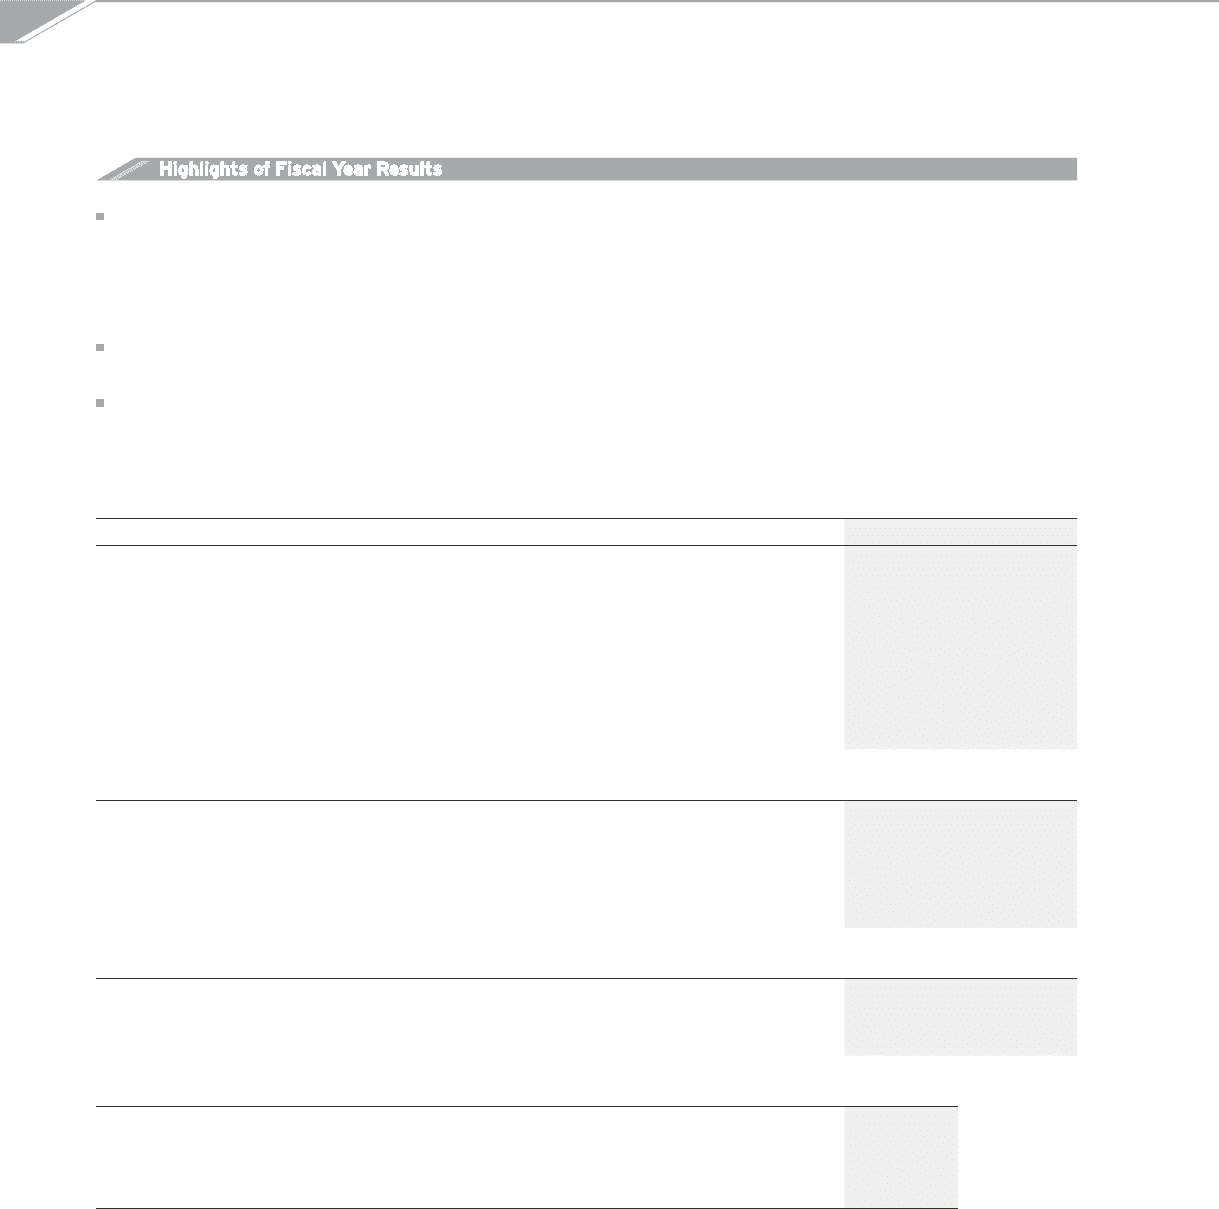
Highlights of Fiscal Year Results
Consolidated Financial Highlights
Mazda Motor Corporation and Consolidated Subsidiaries
Years ended March 31
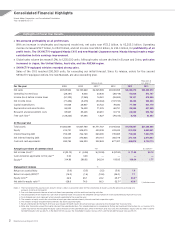
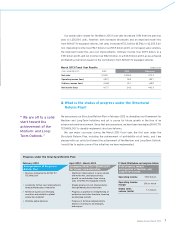
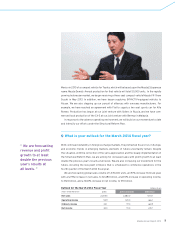
We achieved profitability at all profit levels.
With an increase in wholesales and improved model mix, net sales rose ¥172.2 billion, to ¥2,205.3 billion. Operating
income increased ¥92.7 billion, to ¥53.9 billion, and net income rose ¥142.0 billion, to ¥34.3 billion, for profitability at all
profit levels. The SKYACTIV-equipped Mazda CX-5 and new Mazda6 (Japanese name: Mazda Atenza) made a major
contribution to this earnings improvement.
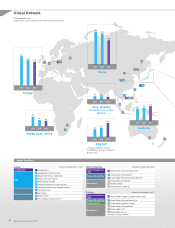
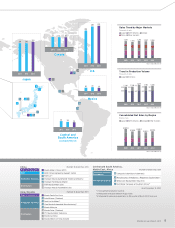
Global sales volume decreased 1.0%, to 1,235,000 units. Although sales volume declined in Europe and China, unit sales
increased in Japan, the United States, Australia, and the ASEAN region.
SKYACTIV-equipped vehicles recorded strong sales.
Sales of the CX-5 reached 200,000 units, far exceeding our initial forecast. Since its release, orders for the second
SKYACTIV-equipped vehicle, the new Mazda6, are also exceeding plan.
Millions of yen
Thousands of
U.S. dollars*1
For the year 2009 2010 2011*72012 2013 2013
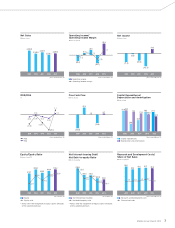
Net sales ¥2,535,902 ¥2,163,949 ¥2,325,689 ¥2,033,058 ¥2,205,270 $23,460,319
Operating income (loss) (28,381) 9,458 23,835 (38,718) 53,936 573,787
Income (loss) before income taxes (51,339) (7,265) 16,081 (55,262) 39,101 415,968
Net income (loss) (71,489) (6,478) (60,042) (107,733) 34,304 364,936
Capital expenditures 81,838 29,837 44,722 78,040 77,190 821,170
Depreciation and amortization 84,043 76,428 71,576 68,791 59,954 637,809
Research and development costs 95,967 85,206 90,961 91,716 89,930 956,702
Free cash flow*2(129,244) 67,394 1,627 (79,415) 8,746 93,043
At the year-end
Total assets ¥1,800,981 ¥1,947,769 ¥1,771,767 ¥1,915,943 ¥1,978,567 $21,048,585
Equity 414,731 509,815 430,539 474,429 513,226 5,459,851
Interest-bearing debt 753,355 722,128 693,000 778,085 718,983 7,648,755
Net interest-bearing debt 532,631 375,825 370,151 300,778 274,108 2,916,043
Cash and cash equivalents 220,724 346,303 322,849 477,307 444,875 4,732,713
Amounts per share of common stock Yen U.S. dollars*1
Net income (loss)*3¥ (52.13) ¥ (4.26) ¥ (33.92) ¥ (57.80) ¥ 11.48 $0.12
Cash dividends applicable to the year*43.00 3.00 — — — —
Equity*5314.98 286.92 242.24 156.85 166.04 1.77
Management indexes %
Return on assets (ROA) (3.8) (0.3) (3.2) (5.8) 1.8
Return on equity (ROE)*6(14.8) (1.4) (12.8) (24.0) 7.1
Equity ratio*622.9 26.1 24.2 26.3*826.9*8
Net debt-to-equity ratio*6128.9 74.0 86.3 52.7*845.0*8
Notes: 1. The translation of the Japanese yen amounts into U.S. dollars is presented solely for the convenience of readers, using the prevailing exchange rate
on March 31, 2013, of ¥94 to US$1.
2. Free cash flow represents the sum of net cash flows from operating activities and from investing activities.
3. The computations of net income (loss) per share of common stock are based on the weighted-average number of shares outstanding during each fiscal year.
4. Cash dividends per share represent actual amounts applicable to the respective year.
5. The amounts of equity used in the calculation of equity per share exclude minority interests and stock acquisition rights.
6. The amounts of equity exclude minority interests and stock acquisition rights.
7. Results information for the March 2011 fiscal year includes 15-month results for certain overseas subsidiaries that changed their fiscal year-end.
8. Ratio after taking into account the capital nature of the subordinated loan. This subordinated loan is recognized by Rating and Investment Information, Inc., as having a 50%
capital equivalence. Not including the equity capital attributes of the subordinated loan, while in the March 2012 fiscal year, the shareholders’ equity ratio was 24.5% and the
net debt-to-equity ratio was 64.2%, in the March 2013 fiscal year, the shareholders’ equity ratio was 25.1% and the net debt-to-equity ratio was 55.2%.
Mazda Annual Report 2013
2