Lumber Liquidators 2009 Annual Report Download - page 63
Download and view the complete annual report
Please find page 63 of the 2009 Lumber Liquidators annual report below. You can navigate through the pages in the report by either clicking on the pages listed below, or by using the keyword search tool below to find specific information within the annual report.-
 1
1 -
2
-
3
-
4
-
5
-
6
-
7
-
8
-
9
-
10
-
11
-
12
-
13
-
14
-
15
-
16
-
17
-
18
-
19
-
20
-
21
-
22
-
23
-
24
-
25
-
26
-
27
-
28
-
29
-
30
-
31
-
32
-
33
-
34
-
35
-
36
-
37
-
38
-
39
-
40
-
41
-
42
-
43
-
44
-
45
-
46
-
47
-
48
-
49
-
50
-
51
-
52
-
 53
53 -
 54
54 -
 55
55 -
 56
56 -
 57
57 -
 58
58 -
 59
59 -
 60
60 -
 61
61 -
 62
62 -
 63
63 -
 64
64 -
 65
65 -
 66
66 -
 67
67 -
 68
68 -
 69
69 -
 70
70 -
 71
71 -
 72
72
 |
 |

Lumber Liquidators Holdings, Inc.
Notes to Consolidated Financial Statements—(Continued)
(amounts in thousands, except share data and per share amounts)
California. LLI intends to defend the claims in this suit vigorously. While there is a reasonable possibility that a material loss
may be incurred, the Company cannot estimate the loss or range of loss, if any, to the Company at this time.
Vazilia Corporation
In July 2006, the Company entered into a purchase agreement with Vazilia Corporation (“Vazilia”) pursuant to which
the Company agreed to purchase a total of approximately 27 million square feet of Vazilia’s assorted products over a four-
year period (the “Purchase Agreement”). After entering into the Purchase Agreement, certain products ordered from Vazilia
were not delivered and certain products that were delivered did not meet the applicable specifications. In October 2008,
Vazilia filed a demand for arbitration in which it alleged that the Company had breached the Purchase Agreement. In
response to the demand for arbitration, the Company asserted a counterclaim against Vazilia in which it asserted that Vazilia
had breached the Purchase Agreement.
In June 2009, the parties reached a settlement pursuant to which, among other things, the parties agreed to terminate the
Purchase Agreement. As a result, the Company has no further obligation to purchase goods from Vazilia. Further, each party
released any claims against the other relating to the Purchase Agreement or arbitration. No payments were made or received
by either party in connection with the settlement.
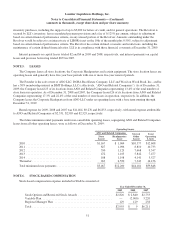
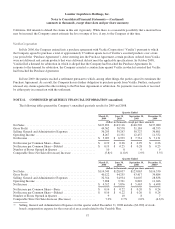
NOTE 12. CONDENSED QUARTERLY FINANCIAL INFORMATION (unaudited)
The following tables present the Company’s unaudited quarterly results for 2009 and 2008.
Quarter Ended
March 31,
2009
June 30,
2009
September 30,
2009
December 31,
2009
(dollars in thousands, except per share amounts)
Net Sales ................................................ $123,852 $143,116 $140,520 $137,080
Gross Profit ............................................. 44,562 50,578 51,184 48,353
Selling, General and Administrative Expenses .................. 36,295 39,247 38,727 36,801
Operating Income ......................................... 8,267 11,331 12,457 11,552
Net Income .............................................. $ 5,093 $ 6,939 $ 7,761 $ 7,131
Net Income per Common Share—Basic ....................... $ 0.19 $ 0.26 $ 0.29 $ 0.26
Net Income per Common Share—Diluted ...................... $ 0.19 $ 0.25 $ 0.28 $ 0.25
Number of Stores Opened in Quarter .......................... 10 8 9 9
Comparable Store Net Sales (Decrease) Increase ................ (5.8)% (1.8)% 1.9% 5.5%
Quarter Ended
March 31,
2008
June 30,
2008
September 30,
2008
December 31,
2008(1)
(dollars in thousands, except per share amounts)
Net Sales ................................................ $114,549 $128,037 $123,063 $116,530
Gross Profit ............................................. 40,122 44,255 43,417 39,884
Selling, General and Administrative Expenses .................. 32,314 34,934 34,607 28,838
Operating Income ......................................... 7,808 9,321 8,810 11,046
Net Income .............................................. $ 4,312 $ 5,876 $ 5,463 $ 6,498
Net Income per Common Share—Basic ....................... $ 0.16 $ 0.22 $ 0.20 $ 0.24
Net Income per Common Share—Diluted ...................... $ 0.16 $ 0.22 $ 0.20 $ 0.24
Number of Stores Opened in Quarter .......................... 9 10 8 7
Comparable Store Net Sales Increase (Decrease) ................ 7.0% 2.7% 2.0% (4.6)%
(1) Selling, General and Administrative Expenses for the quarter ended December 31, 2008 includes ($2,960) of stock-
based compensation expense for the reversal of an accrual related to the Variable Plan.
57