Lumber Liquidators 2009 Annual Report Download - page 37
Download and view the complete annual report
Please find page 37 of the 2009 Lumber Liquidators annual report below. You can navigate through the pages in the report by either clicking on the pages listed below, or by using the keyword search tool below to find specific information within the annual report.-
 1
1 -
2
-
3
-
4
-
5
-
6
-
7
-
8
-
9
-
10
-
11
-
12
-
13
-
14
-
15
-
16
-
17
-
18
-
19
-
20
-
21
-
22
-
23
-
24
-
25
-
26
-
 27
27 -
 28
28 -
 29
29 -
 30
30 -
 31
31 -
 32
32 -
 33
33 -
 34
34 -
 35
35 -
 36
36 -
 37
37 -
 38
38 -
 39
39 -
 40
40 -
 41
41 -
 42
42 -
 43
43 -
 44
44 -
 45
45 -
 46
46 -
 47
47 -
48
-
49
-
50
-
51
-
52
-
53
-
54
-
55
-
56
-
57
-
58
-
59
-
60
-
61
-
62
-
63
-
64
-
65
-
66
-
67
-
68
-
69
-
70
-
71
-
72
 |
 |

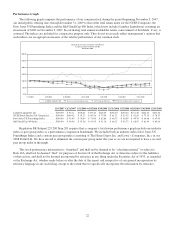
The effective tax rate decreased to 39.0% for 2009 primarily due to reductions in tax-exempt interest income, state
income taxes and excess tax benefits on stock option exercises. The effective tax rate of 41.4% for 2008 included a first
quarter charge of approximately $0.7 million for nondeductible deferred taxes related to the Variable Plan.
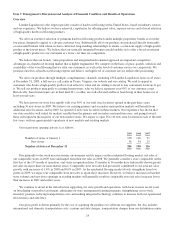
Net Income.
For the year ended
December 31,
2009 2008
(dollars in thousands)
Net Income ................................................ $26,924 $22,149
As a percentage of net sales ............................... 4.9% 4.6%
Net income increased 21.6% for the year ended December 31, 2009 in comparison to the year ended December 31,
2008.
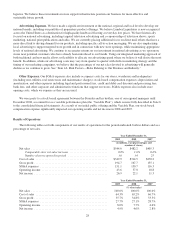
Year Ended December 31, 2008 Compared to Year Ended December 31, 2007
Net Sales.
For the year ended
December 31,
2008 2007
(dollars in thousands)
Net sales ................................................ $482,179 $405,307
Comparable store net sales increase ........................... 1.6% 8.6%
Net sales for 2008 increased $76.9 million, or 19.0%, over 2007 due to a $6.5 million increase in comparable store net
sales and an increase of $70.4 million in non-comparable store net sales. Overall, net sales increased due principally to the
following factors:
• A broader assortment of premium products in certain key product lines such as handscraped hardwoods, bamboo
and laminate products offered under a number of our proprietary brands, continued to drive increased demand.
Partially offsetting this benefit were decreases in the sales mix of certain Bellawood and certain other hardwoods
which generally carry higher than average retail prices per unit sold.
• Net sales of moldings and accessories increased 36.3% and represented 11.0% of net sales in 2008, up from 9.6%
of net sales in 2007, as we continued to broaden our assortment and strengthened our commitment to a more
consistent in-stock position.
• The increased availability of special liquidation deals in 2008 allowed us to add selective merchandise offerings
that presented a value opportunity for the customer while creating promotional opportunities for us to drive
incremental consumer traffic, a portion of which was converted to demand for our proprietary brands.
• Comparable store net sales were driven primarily by the continued maturation of stores in operation for 13 to 36
months at December 31, 2008, where net sales increased 12.8%. Net sales at these comparable stores generally
increase faster than at our mature stores, where net sales declined 0.7%. We believe our stores in operation for
more than 36 months are more likely to be adversely impacted by the opening of non-comparable stores in an
existing market. Excluding the net sales of markets which include a non-comparable store and at least one
comparable store older than 36 months, net sales at these more mature stores increased 4.2%.
31