Lumber Liquidators 2009 Annual Report Download - page 40
Download and view the complete annual report
Please find page 40 of the 2009 Lumber Liquidators annual report below. You can navigate through the pages in the report by either clicking on the pages listed below, or by using the keyword search tool below to find specific information within the annual report.-
 1
1 -
2
-
3
-
4
-
5
-
6
-
7
-
8
-
9
-
10
-
11
-
12
-
13
-
14
-
15
-
16
-
17
-
18
-
19
-
20
-
21
-
22
-
23
-
24
-
25
-
26
-
27
-
28
-
29
-
 30
30 -
 31
31 -
 32
32 -
 33
33 -
 34
34 -
 35
35 -
 36
36 -
 37
37 -
 38
38 -
 39
39 -
 40
40 -
 41
41 -
 42
42 -
 43
43 -
 44
44 -
 45
45 -
 46
46 -
 47
47 -
 48
48 -
 49
49 -
 50
50 -
51
-
52
-
53
-
54
-
55
-
56
-
57
-
58
-
59
-
60
-
61
-
62
-
63
-
64
-
65
-
66
-
67
-
68
-
69
-
70
-
71
-
72
 |
 |

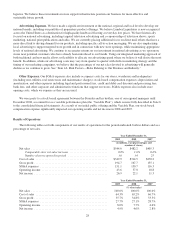
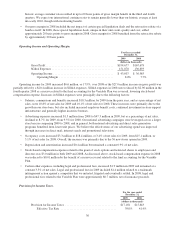
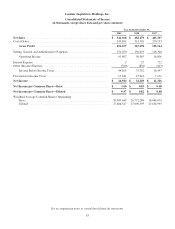
Net Income.
For the year ended
December 31,
2008 2007
(dollars in thousands)
Net Income ................................................ $22,149 $11,326
As a percentage of net sales ............................... 4.6% 2.8%
Net income increased 95.6% for the year ended December 31, 2008 in comparison to the year ended December 31,
2007.
Liquidity and Capital Resources
Our principal liquidity requirements have been to meet our working capital and capital expenditure needs. Our principal
sources of liquidity are $35.7 million of cash and cash equivalents at December 31, 2009, our cash flow from operations, and
$25.0 million of availability under our revolving credit facility. We expect to use this liquidity for general corporate
purposes, including providing additional long-term capital to support the growth of our business (primarily through opening
new stores) and maintaining our existing stores. We believe that our cash flow from operations, together with our existing
liquidity sources, will be sufficient to fund our operations and anticipated capital expenditures over at least the next 24
months.
Prior to our IPO in November 2007, we funded these requirements primarily through cash flows from operations and
short-term and long-term borrowings. Upon completion of our IPO, we received net proceeds of approximately $36.2
million. We used a portion of those proceeds to repay $6.6 million outstanding under an existing term loan.
In 2010, we expect capital expenditures to total between $15 million and $19 million. In addition to general capital
requirements, we intend to:
• open between 36 and 40 new store locations;
• enhance our information technology systems through an integrated solution to benefit management reporting and
planning, business continuity and disaster recovery, and overall system security;
• continue remodeling existing store showrooms to enhance consistency in presentation; and
• make improvements to our Corporate Headquarters in Toano, Virginia.
Cash and Cash Equivalents
In 2009, cash and cash equivalents increased $0.5 million to $35.7 million. The increase in cash and cash equivalents
was primarily due to $7.8 million of cash provided by operating activities and $3.3 million of proceeds received from stock
option exercises, which was offset by the use of $11.4 million to purchase property and equipment. In 2008, cash and cash
equivalents increased $2.0 million to $35.1 million. The primary contributor to the increase in cash and cash equivalents was
$9.4 million of cash provided by operating activities, partially offset by the use of $6.6 million to purchase property and
equipment and $0.8 million to purchase the phone number 1-800-HARDWOOD and related internet domain names. During
2007, cash and cash equivalents increased $29.2 million to $33.2 million. We received $36.2 million from our IPO in
November 2007 and operating activities provided $8.5 million. These increases of cash and cash equivalents were partially
offset by the use of $6.0 million to purchase property and equipment and $9.5 million of net repayments of long-term debt
and capital leases.
Cash Flows
Operating Activities. Net cash provided by operating activities was $7.8 million for 2009, $9.4 million for 2008 and
$8.5 million for 2007. The $1.6 million decrease from 2008 to 2009 reflects a larger build in inventory, net of accounts
payable, partially offset by more profitable operations. The $0.8 million increase from 2007 to 2008 reflects more profitable
operations and a lesser build in inventory, net of accounts payable, partially offset by the timing of changes in certain other
assets and liabilities.
34